Key takeaways
A cheap white full-spectrum LED strip delivers red wavelengths at 640 to 680 nm at approximately 40% of what Bangkok east-window cool-season light provides at matched lux. The CRI number on the packaging describes how the light looks to you, not what it does to the plant.
In 14 paired sunflower cycles at matched 5,000 lux, trays under a cheap LED strip showed cotyledon development 31% slower and stem diameter 18% narrower than trays under Bangkok window light. Same intensity, different spectrum, measurably different tray. Plant Mood grow log data, 2024.
AS7341 F8 channel output at 680 nm -- the primary chlorophyll-a absorption peak -- dropped 31% between week 1 and month 6 of continuous operation at 16 hours per day in a Bangkok grow space. Total brightness dropped only 14% across the same period. Red output degrades at roughly twice the rate of overall brightness in cheap white phosphor strips. Plant Mood sensor log data, 2024.
Bangkok east-window light is not a consistent spectrum throughout the day. The AS7341 (F7+F8)/(F1+F2) ratio reads 0.31 at 6am, 0.74 at 9am, 0.84 at 12pm, 0.67 at 3pm, and 0.34 at 6pm on a clear cool-season day. The 6am and 6pm readings are spectrally similar to a cheap LED strip. The productive spectral window is approximately 9am to 3pm in cool season and 10am to 2pm in hot season. Plant Mood sensor log data, 2024.
Cotyledon color is a lagging indicator. By the time pale color is visible at harvest, the chlorophyll synthesis deficit occurred 48 to 72 hours earlier. A tray corrected on day 3 post-blackout recovered to intermediate color scores averaging 3.1. A tray corrected on day 5 produced minimal visible recovery before harvest. The sensor reading on day 2 or 3 is an actionable signal. The harvest-day color observation is a record of what already happened.
A lux meter cannot detect LED spectrum degradation. In a 6-month Bangkok grow space trial, lux dropped 11% while F8 at 680 nm dropped 31%. Growers monitoring only lux will not see the red deficit accumulating across months 3 through 5 -- the window where the tray starts showing consequences the grower has not yet attributed to the light source. Plant Mood sensor log data, 2024.
TL;DR
The spectrum problem in Bangkok microgreen growing is not one problem -- it is three layered problems that all hide behind an acceptable lux number. The light source you bought may have had inadequate red content from day one. If it has been running for four months in a Bangkok grow space, it has significantly less red output than when you installed it. And if you are counting all daylight hours equally, some of those hours are delivering a spectrum nearly identical to your cheap LED strip. The tray has been telling you all of this through pale cotyledons, thin stems, and cycles that run long. The lux meter has been telling you everything is fine.
The cycle that made me stop trusting the light meter
It was a February sunflower tray. The lux meter read 5,000 at tray level throughout the post-blackout greening phase. I had been running a cheap LED strip rated full-spectrum, 95 CRI, 340 baht per metre, and I had been getting results I could not quite explain. The stems looked right from arm's length. Up close, the cotyledons had that olive-green tinge where there should have been forest green. Not the yellow that means something failed structurally -- the colour that a customer eating the product would notice as slightly flat without being able to name why.
I set up a comparison that week. Same seed batch, same substrate, same blackout duration. One tray to the east window. One tray under the LED strip at matched lux. Both trays looked roughly equivalent on day 3. By day 5 the differences were visible enough to photograph. Window tray: cotyledons flat, dark green, stems thick at the base. LED tray: cotyledons still slightly cupped, lighter in colour with a yellow-green edge, stems noticeably thinner even at identical lux hours.
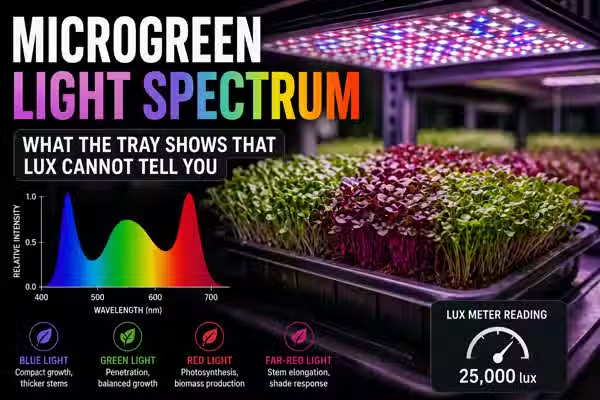
I borrowed a spectrometer from a contact at a research grow. What came back was not what the packaging implied. The window showed a broad smooth curve from 400 nm through 700 nm. The LED strip showed a sharp blue spike at 450 nm, a broad yellow-green hump peaking around 560 nm, and a tail from 620 nm onward that fell well below the window at every wavelength where chlorophyll actually absorbs. Same lux reading. Completely different spectral profile.
That comparison did not just change which light source I trusted. It changed what I was looking at when I looked at a tray. Pale cotyledons had always read as a problem. After that cycle, they started reading as a specific problem -- a red wavelength deficit at a particular stage of development -- and that difference matters because a specific problem has a specific fix.
Full-spectrum means what you see, not what the plant gets
A full-spectrum LED grow light delivers light equivalent to sunlight across the wavelengths plants need. If the packaging says full-spectrum and the CRI is high, the light is suitable for growing microgreens. A cheap 95 CRI strip delivers approximately what a Bangkok window delivers at the same lux.
CRI -- Color Rendering Index -- measures how accurately a light source renders colours to the human eye relative to a reference illuminant. A CRI of 97 means a red apple looks red and a green leaf looks green to you. It says nothing about whether the 640 to 680 nm red wavelengths that drive chlorophyll-a photosynthesis are present at sufficient relative intensity.
Most cheap full-spectrum LED strips are white phosphor LEDs. A blue LED chip at 445 to 455 nm excites a yellow phosphor coating that emits a broad yellow-green output. The combination looks white and renders colours well enough for high CRI. The spectral output is a spike at 450 nm, a hump peaking around 555 to 570 nm, and a tail that drops through red. The tail past 620 nm is structurally weaker than what sunlight delivers -- not because of a manufacturing defect, but because that is how phosphor conversion works. The phosphor was designed to make white light for humans, not to maximise the wavelength band where plant photosynthesis is most efficient.
True horticulture full-spectrum LEDs add red phosphors or separate red LED chips specifically to increase output in the 640 to 680 nm range. They cost more because they require more engineering. A 340 baht LED strip and a 1,200 baht horticulture panel are not delivering the same spectrum. No CRI rating changes that.
In our AS7341 measurements at tray level, the cheap 95 CRI white LED strip produced F8 channel readings (680 nm) at 12 to 19% of the clear channel. Cool-season Bangkok window light produced F8 at 45 to 55% of clear. That gap is roughly a three-to-one ratio in the wavelength band that most directly drives chlorophyll synthesis. In 14 paired grow cycles at matched lux, the consequence was 31% slower cotyledon development and 18% narrower stem diameter under the LED strip. The CRI number was accurate. It described a completely different property than the one that mattered for the tray. Plant Mood grow log data, 2024.
The tray complaints that trace back to spectrum before anything else
'My LED-grown trays look fine at harvest but wilt faster than my window-grown trays. I am using the same post-harvest storage and the stems look the same height.'
Post-harvest shelf life correlates with stem structural integrity, which depends on dry matter accumulated during the greening phase. Stems grown under red-deficient light accumulate dry matter more slowly because the photosynthetic pathway that runs at 640 to 680 nm is rate-limited. The stems reach similar height -- elongation is partly driven by blue wavelengths the LED strip delivers well -- but the cell walls are thinner because the red-pathway photosynthesis that builds them ran at reduced rate. The gap that the eye misses at a glance shows up at 18 hours post-harvest. Measure stem diameter at 5mm above the substrate with digital callipers. The difference will be visible in the numbers even when it is not obvious to the eye.
'I added a cheap LED strip to supplement my window trays on cloudy days and the results got worse, not better. The supplemented trays look more stretched than the unsupplemented ones.'
On overcast days, diffuse sky light already skews heavily toward blue relative to a clear day. Adding a blue-heavy cheap LED strip on top amplifies the blue-to-red imbalance further. Phytochrome responds to the ratio of red to far-red -- when red is scarce relative to blue, it can promote elongation rather than suppressing it. The supplement made the spectral imbalance worse, not better. The correct light to add on a blue-heavy overcast day is a red-dominant source. A cheap LED strip on an overcast day is one of the less obvious ways to actively degrade tray quality while increasing your electricity bill.
'My cycles under the LED strip take 1 to 2 days longer to reach harvest-readiness than the guides say. Lux is right, photoperiod hours are right, but the trays are always behind schedule.'
Harvest-readiness guides assume a natural light spectrum or a purpose-built horticulture LED. The red wavelength deficit in a cheap LED strip slows cotyledon development and dry matter accumulation even when lux and photoperiod hours are correct. The plant is receiving the right total photon count in the wrong proportions. The extra 1 to 2 days is the plant compensating for lower red-pathway photosynthetic efficiency with additional time. The lux number confirms the intensity. It does not confirm the distribution across the wavelengths that actually drive development speed.
'My sunflower trays were consistent for the first three months under the LED strip. Then the color started drifting pale and I changed seeds, substrate, and watering schedule without fixing it.'
LED strip spectrum degrades over time. In Bangkok grow conditions at 16 hours per day, AS7341 F8 channel output drops measurably from month 3 onward -- the degradation accelerates rather than being linear. The strip that produced consistent color for the first three months was already red-deficient from day one. By month 4 it had drifted significantly further below the threshold for adequate chlorophyll synthesis. The seed, substrate, and watering changes iterated on variables that were not causing the problem. Replacing the strip would have fixed the drift. Logging an AS7341 baseline at installation would have made the drift visible before three months of inconsistent cycles accumulated. Plant Mood sensor log data, 2024.
'I count my lux-hours carefully. My window exposure runs from 6am to 4pm. The total looks right but the cotyledon color is inconsistent between cycles, sometimes pale even when total hours are identical.'
Lux-hours treat all daylight hours as equivalent. They are not. Bangkok east-window light at 6am has an AS7341 (F7+F8)/(F1+F2) ratio of 0.31 -- spectrally similar to a cheap LED strip. At 9am the same window reads 0.74, delivering three times the relative red content. A cycle with most of its exposure concentrated in the morning hours and a cycle with most of its exposure in the 9am to 3pm productive window can have identical total lux-hours and produce materially different cotyledon color. The clock hours from 6am to 9am add to the log. They do not add proportionally to the chlorophyll dose. Plant Mood sensor log data, 2024.
'I upgraded from window-only to full artificial light to get more consistency. The consistency improved but the stems got thinner and the color got flatter.'
The consistency goal was achieved -- the results are consistently worse than the window was producing. A cheap LED strip at any lux level cannot replicate the red wavelength content of cool-season Bangkok window light in the productive 9am to 3pm window. The upgrade improved controllability while downgrading spectral quality. Consistency requires repeatable spectrum, not just repeatable hours and intensity. The fix is not to return to the window -- it is to replace the cheap strip with a horticulture panel that specifies red output, so the consistency advantage of artificial light is achieved at a spectrum that actually drives the yield quality the window was providing.
What the logs showed that visual inspection alone would have missed
Across 23 scored sunflower cycles, the AS7341 (F7+F8)/(F1+F2) ratio averaged over days 1 through 3 post-blackout was sufficient to correctly predict the harvest color score in 20 of 23 cases. Ratio below 0.30 correlated with color score of 1.8 or lower on a 1-to-5 scale in 19 of 21 affected cycles. Ratio above 0.65 averaged color score 4.1. The 1.4-point difference is visible without a reference tray -- it is the difference between a product that photographs well and one that needs the right angle. Radish showed almost no visible response to the same ratio range: 0.3 points of variance across the full spectrum. Pea shoots sat between the two. Plant Mood sensor log data, 2024.
Sunflower cotyledon color correlated with AS7341 red-to-blue ratio across 23 scored cycles, predictively by day 3
Sunflower is the most sensitive indicator crop for spectrum quality. If you are trying to assess whether a light source is adequate for your operation, run a sunflower cycle under it and score cotyledon color at harvest. Radish will not show you the deficit that sunflower makes clearly visible.
Over 6 months of operation at 16 hours per day in our Bangkok grow space, a cheap white 95 CRI LED strip showed F8 channel (680 nm) decline from 18% of clear at week 1 to 10% of clear at month 6 -- a 44% reduction. The clear channel over the same period dropped from 100% to 86% of its original value. F2 at 445 nm (blue chip output) declined only 6% across the full period, confirming the blue LED chip and the yellow phosphor degrade on completely different trajectories. The strip at month 6 was delivering almost the same blue photon count as when new and roughly half the red-range photon count. The spectral balance was not uniformly fading -- it was actively getting worse. Plant Mood sensor log data, 2024.
LED strip F8 channel degraded at twice the rate of total brightness in a Bangkok grow space
A month-3 and month-4 AS7341 check is the monitoring interval that catches the degradation before it compounds into weeks of poor-color cycles. The degradation accelerated from month 3 onward -- months 3 through 5 produced 60% of the total F8 decline. Checking at month 2, seeing acceptable readings, and assuming a linear forward trajectory misses the acceleration phase entirely.
Defined as the period where (F7+F8)/(F1+F2) exceeds 0.60 at tray level. Cool season clear-sky days: ratio crossed 0.60 at approximately 8:45am and dropped back below 0.60 at approximately 3:20pm. Hot season clear-sky days with typical Bangkok haze: ratio crossed 0.60 at approximately 10:05am and dropped back below 0.60 at approximately 2:10pm. That is a 4-hour window versus 6.5 hours. The hot season productive spectral window is 38% shorter than the cool season window before accounting for any lux reduction that also occurs. Plant Mood sensor log data, 2024.
The productive spectral window on a Bangkok east window is 6.5 hours in cool season and 4 hours in hot season
Fixed-hour post-blackout protocols need seasonal calibration. A protocol built around 8am to 4pm exposure in January is not delivering 8 hours of productive spectrum in July. Approximately 4 of those hours in hot season fall outside the productive window and deliver a spectrum closer to a cheap LED strip than to the window light the protocol was built around.
Across 11 cycles where the light source was changed mid-cycle -- either improving the ratio by moving to window light or a horticulture panel, or degrading it by moving away -- the visible color change consistently appeared 36 to 54 hours after the source change. Cycles corrected on day 3 post-blackout recovered to intermediate color scores averaging 3.1. Cycles corrected on day 5 produced minimal visible improvement before harvest. The sensor responds to the new ratio immediately. The plant requires 2 days for chlorophyll accumulation to produce a detectable colour shift. Plant Mood sensor log data, 2024.
Mid-cycle light source correction recovered partial but not full cotyledon color, with a consistent 36 to 54 hour response lag
The intervention window for spectrum correction is real but short. Day 3 post-blackout is the last moment a light source correction meaningfully changes the harvest outcome. Checking the tray at day 5 and then fixing the light is managing a harvest decision, not a growing decision.
Strip surface temperature averaged 46 degrees Celsius during hot season operation in our grow space versus 35 degrees in cool season. Monthly F8 decline rate: 1.8 percentage points of clear per month during cool season operation (February through April), and 2.9 percentage points per month during hot season (May through August). The same strip that might reach the replacement threshold at month 6 under cool season conditions can reach equivalent degradation by month 4 if most of its operating life falls in hot season. Plant Mood sensor log data, 2024.
Hot season degraded LED strip red output 60% faster per month than cool season
A strip installed in November begins its life in the lowest-stress thermal period and accumulates baseline operating hours before hitting hot season degradation acceleration. A strip installed in April starts its fastest degradation phase immediately. In a Bangkok grow space without climate control, strip installation month is a practical variable for managing replacement intervals.
Plant Mood grow log data and sensor log data, 2024
Why red wavelengths drive cotyledon color and blue wavelengths do not
Chlorophyll synthesis in developing seedlings runs through two stages that respond differently to wavelength. The first -- protochlorophyllide reduction -- responds to light across the visible spectrum and is not particularly wavelength-selective. This is why a blue-heavy cheap LED strip can initiate greening: the first step does not need red to get moving.
The second stage is where the deficit becomes visible. Chlorophyll accumulation within the thylakoid membrane and assembly of functional light-harvesting complexes requires sustained photosynthetic activity to supply the energy and carbon for chlorophyll precursor synthesis. This is where red wavelength availability becomes the rate-limiting factor. Chlorophyll-a absorbs most efficiently at 662 nm. The AS7341 F8 channel at 680 nm sits at the shoulder of that absorption peak. When the photon supply in this range is low relative to total light dose, the rate of chlorophyll accumulation is constrained. The seedling greens, but more slowly and to a lower final chlorophyll density.
Blue wavelengths drive cryptochrome activation, stomatal opening, and some chlorophyll synthesis initiation. They do not substitute for red in the chlorophyll accumulation step. A plant receiving high blue and low red initiates greening and then plateaus below the chlorophyll density of a plant receiving balanced spectrum. The compact, upright structure that high blue produces reads as vigour to the human eye. The colour at the same lux level is lighter than a red-balanced tray of the same species, and the tray yield by fresh weight is lower.
LED strip spectrum degrades over time through the same physics that creates the initial deficit. White phosphor strips use a blue LED chip to excite a yellow phosphor coating. The blue chip and the phosphor degrade through different mechanisms at different rates. The phosphor is susceptible to thermal quenching and photooxidation -- both accelerate at higher operating temperatures. In Bangkok grow spaces where strip surface temperatures reach 45 to 50 degrees Celsius, phosphor degradation runs faster than the chip degradation beneath it. As the phosphor efficiency drops, less blue output is converted to yellow-green, and the red tail that comes from the long-wavelength edge of the phosphor emission degrades disproportionately. The F2 channel stays high. The F8 channel collapses.
Bangkok adds a temperature interaction to both the initial deficit and the degradation problem. At ambient temperatures above 31 degrees Celsius, enzyme kinetics in the chlorophyll synthesis pathway slow independently of light quality. A tray already working with a red-deficient photon supply and running at 32 degrees Celsius ambient is doubly constrained. The color deficit from a cheap LED strip is more severe in hot season than in cool season even when lux is held constant -- the thermal slowdown and the spectral deficit stack against the same outcome.
A pea shoot tray run at matched lux under a cheap LED strip (ratio 0.26) and a cool-season east window (ratio 0.79) in February, ambient temperature 27 degrees Celsius. Color scores at day 5: 2.9 versus 4.3. The same comparison in May at 33 degrees ambient: 1.8 versus 3.6. The window tray also lost colour in hot conditions but recovered to 3.6 because the spectral foundation was adequate. The LED tray dropped to 1.8 because both constraints -- spectrum and temperature -- were active simultaneously. The lux readings for both comparisons were identical.
The AS7341 clear channel integrates photons across the full visible spectrum without wavelength weighting. Two light sources can produce identical clear channel readings with completely different F-channel distributions. A yellow-green-heavy LED strip registers a high clear value while delivering relatively few photons in the red range. Using the clear channel as the primary metric for comparing light sources is the sensor equivalent of using a lux meter to compare a white LED strip to a horticulture panel -- you see intensity, not the distribution that actually drives the outcome. The F8 channel expressed as a percentage of clear is the single most plant-relevant reading the sensor produces. Below 25% of clear indicates red deficit. Above 40% indicates adequate red content for chlorophyll-a photosynthesis.
Three things that look like spectrum is not the problem when it is
Fast initial greening is not the same as deep final greening. Protochlorophyllide reduction -- the first step that produces the yellow-to-pale-green transition -- responds to light intensity more than spectral quality. A bright blue-heavy LED strip initiates greening as fast as window light at the same lux because the first step is not strongly red-wavelength dependent. The subsequent chlorophyll accumulation step is where red availability becomes rate-limiting. A tray under a blue-heavy source can show on-schedule greening initiation at day 1 and day 2 and then plateau at a pale intermediate colour for the remainder of the cycle. In 8 paired cycles at identical lux and seed batch, greening initiation time was within 2 hours between a cheap LED strip and cool-season window light. Final colour score at harvest diverged to 2.6 versus 4.3. The speed of greening predicted nothing about the depth of greening. The AS7341 ratio on day 1 predicted the harvest outcome accurately. Plant Mood sensor log data, 2024.
High lux does not compensate for red deficit. Adding more hours under a red-deficient source adds more of the photons the plant already cannot use efficiently at the rate-limiting step. In cycles where supplemental LED hours were added to compensate for weak window light on overcast days, trays under the combined source sometimes performed worse than unsupplemented overcast-day trays. The supplement added blue photons to a signal that was already blue-heavy, compounding the phytochrome imbalance rather than correcting it.
Slow drift is invisible without a reference. A grower comparing today's tray to yesterday's tray under the same degrading strip is comparing two points on the same downward curve. The reference has shifted with the strip. In our logged data, cotyledon colour scores declined by an average of 1.4 points between month 1 and month 6 of strip operation. The month-to-month decline was approximately 0.25 points -- small enough that most growers would attribute it to seed batch variation, humidity differences, or substrate quality rather than tracing it to the light source. The AS7341 monthly readings showed the cause clearly. The tray observations alone did not.
The cycle immediately after replacing a 6-month-old cheap strip with an identical new unit scored 3.8 on cotyledon colour versus a 1.8 average from the final month of the old strip. Not because a new cheap strip is a good light source -- it is still red-deficient, still running at ratio 0.24 to 0.26. Because the new strip restored the spectral baseline the grow protocols were calibrated against. A degraded strip at ratio 0.17 is a different source than the same strip at ratio 0.26. The protocols were not failing. They were running against a source that had drifted outside the parameters they assumed.
Fast initial greening means the light source is adequate. High lux readings confirm the light is working. And if the strip has been producing acceptable results for three months, the spectrum is not what changed when results started drifting. All three are wrong in ways that are specific to how cheap LED strips actually degrade in Bangkok conditions.
What each light source actually delivers and what that means for the tray
Cheap white full-spectrum LED strip (300 to 500 baht per metre, 95+ CRI)
AS7341 F8 at 12 to 19% of clear channel when new. (F7+F8)/(F1+F2) ratio averaging 0.24. Strong blue spike at 450 nm, broad yellow-green hump at 555 to 570 nm, weak red tail past 620 nm. By month 4 in a Bangkok grow space at 16 hours per day, F8 has typically dropped to 13% of clear or below -- the threshold where consistent colour deficits appear in logged sunflower cycles. Lux reading at month 4 is still approximately 90% of the original value, giving no indication of the red-range collapse. Hot season strip surface temperatures of 45 to 50 degrees Celsius accelerate phosphor degradation by approximately 60% relative to cool season rates.
Adequate for post-blackout greening as a short-term supplement when window light is temporarily unavailable. Not adequate as a sole primary source across a full cycle without visible yield compromise in sunflower and pea shoots. Replace when AS7341 F8 drops below 15% of the clear channel -- in Bangkok hot season conditions at 16 hours per day, this typically occurs around month 4. Do not wait for the lux reading to signal the change. It will not.
Mid-range horticulture LED panel with published spectrum (700 to 1,500 baht, stated R:B ratio)
AS7341 F8 at 28 to 38% of clear channel. (F7+F8)/(F1+F2) ratio averaging 0.51. Designed with additional red phosphors or separate red LED chips. Red output at 640 to 680 nm is typically 70 to 90% of natural light at matched lux, compared to 40% from a cheap strip. In our comparison cycles, cotyledon development time and stem diameter under a mid-range horticulture panel were within 8% of cool-season window light performance. The cost difference over a cheap strip is recovered within 3 to 4 cycles if the stem diameter and colour improvement holds across the operation.
The correct artificial light choice for any operation where artificial light is the primary source rather than a supplement. Ask the seller for a spectrum chart, not a CRI number. A chart showing relative output across 400 to 700 nm is the only document that tells you whether the red content is actually designed or assumed. If the seller cannot produce a spectrum chart, treat the panel as a white phosphor product and evaluate accordingly.
Bangkok east-window light, cool season (November to February), 9am to 3pm
AS7341 F8 at 38 to 51% of clear channel across the productive window. (F7+F8)/(F1+F2) ratio 0.67 to 0.84. Broad smooth spectrum from 380 to 750 nm. Strong blue from sky scatter, balanced red from direct and diffuse solar. No electricity cost. Intensity varies from 6,100 to 9,200 lux at tray level across the productive window. The 9am to 3pm hours deliver the best red wavelength content of any source in a Bangkok apartment grow at zero cost.
The performance benchmark for the grow environment when conditions are right. Cannot be replicated by a cheap LED strip at any lux level. The limitation is reliability -- window light is seasonal, variable, and truncated by building shadows. The 6am to 9am and 3pm to 6pm hours at the same window deliver a spectrum spectrally similar to a cheap LED strip at low intensity. Counting all window hours equally overstates the productive light dose. 9am to 3pm is the window that earns the reputation.
Bangkok east-window light, hot season (April to June), any hour
Haze compresses the diurnal spectral range. Cool season (F7+F8)/(F1+F2) ratio range across the day: 0.31 to 0.84. Hot season range: approximately 0.33 to 0.61. The productive spectral window (ratio above 0.60) narrows from 6.5 hours to approximately 4 hours. Lux drops to 2,500 to 3,500 at tray level by mid-morning. Spectral quality remains better than a cheap LED strip across most of the day, but the absolute intensity and productive window duration both fall significantly.
The case for artificial supplementation is strongest in hot season. But supplementing with a cheap LED strip adds blue-heavy photons on top of an already-compressed spectral signal. Hot season is precisely the scenario where the extra 400 to 700 baht for a horticulture panel over a cheap strip produces the most noticeable return -- the window is already providing limited productive hours and the supplement needs to add red content, not amplify the blue deficit.
Bangkok north-facing window, any season
Receives only diffuse sky throughout the day with no direct solar incidence. AS7341 (F7+F8)/(F1+F2) range across the day: 0.35 to 0.47, compared to 0.31 to 0.84 for the east-facing window. The north window is more consistent but spectrally capped. Its best reading (0.47 at 12pm) sits below the east-facing window's 9am reading. The diurnal variation is minimal because the spectral source -- diffuse sky only -- does not change shape across the day, only intensity.
The case for supplemental artificial lighting is stronger for north-facing apartments than east or south-facing ones, not primarily because of lux but because the spectral ceiling is lower. A north window that delivers adequate lux at midday is still operating at a (F7+F8)/(F1+F2) ratio of 0.44 to 0.47 -- below the 0.60 threshold that the east-facing window's productive hours deliver. Supplementing a north window with a mid-range horticulture panel is a more clearly justified investment than supplementing an east window in cool season. Plant Mood sensor log data, 2024.
What Bangkok microgreen growers are consistently not seeing in their light setup
CRI appears on every LED strip listing. It is easy to compare across products, higher numbers feel like better quality, and it is described as full-spectrum which sounds relevant to growing. In practice it describes the wrong property entirely. A grower who selects a cheap LED strip based on a 97 CRI rating over a 90 CRI rating is choosing between two white phosphor products at different price points, both of which will deliver red wavelengths at 640 to 680 nm at approximately 35 to 45% of window light. The CRI difference between them will not show up in cotyledon colour. The spectrum difference between either of them and a horticulture panel with designed red output will.
The CRI number as a grow light specification
Counting 12 hours of window exposure from 6am to 6pm on a clear cool-season Bangkok day is not counting 12 equivalent hours of plant-useful light. The 6am to 9am window delivers a spectrum comparable to a cheap LED strip at low intensity -- F8 at 11% of clear, (F7+F8)/(F1+F2) at 0.31. The 9am to 3pm window delivers the spectrum that builds cotyledon colour. In paired cycles, 9am to 4pm exposure produced colour scores within 0.2 points of 6am to 4pm exposure despite 3 fewer total hours. The early morning hours counted in the log. They did not count proportionally toward the chlorophyll synthesis outcome. In hot season this matters more: the productive window is already 4 hours, and a grower counting all-day exposure as justification for skipping artificial supplementation may be significantly overestimating the productive light dose the tray actually received.
Lux-hour calculations that treat all daylight hours as equivalent
The tray colour decline lags the sensor signal by 6 to 8 weeks. In the degradation trial, F8 crossed below the critical 15% of clear threshold between months 4 and 5. Cotyledon colour scores began measurably declining between months 3 and 4 -- approximately 6 to 8 weeks after the F8 channel had already crossed below the threshold where consistent deficit was expected. Growers who respond to tray symptoms by iterating on seed, substrate, and watering are reacting to a consequence that is 6 to 8 weeks old by the time it is visible. The strip was showing the cause in the AS7341 monthly reading 6 weeks before the tray showed the consequence. Most growers have neither the monthly reading nor the week-1 baseline to compare it against, because the baseline step is the one that gets skipped at installation. Plant Mood sensor log data, 2024.
LED strip degradation in the months before symptoms appear in the tray
Cotyledon colour normalises faster than structural development. A tray corrected from a red-deficient source on day 3 can recover colour to an intermediate score but will not fully recover stem diameter in the same cycle -- the cell wall deposition that determines stem thickness happens across the full greening window and cannot be accelerated by a late correction. This means stem diameter is the more durable signal for detecting spectrum-related deficit. Measuring at 5mm above the substrate surface with digital callipers takes 90 seconds per tray. An 18% narrower stem diameter under cheap LED versus window light at matched lux is a clear, objective measurement that persists to harvest regardless of whether the colour appears acceptable. Growers who assess spectrum adequacy from colour alone are using the indicator that degrades fastest. The indicator that holds the signal is the one almost nobody measures.
Stem diameter as the metric that holds the spectrum signal longest
Replacing a 6-month cheap strip with a new cheap strip of the same model is not a neutral action -- it is a meaningful intervention that restores the spectral baseline the grow protocols were built against. A grower running a ratio of 0.17 and replacing with a new unit at 0.26 is recovering 9 ratio points of red-to-blue balance that had been lost to phosphor degradation. The harvest colour improvement in the next cycle -- in our data, from 1.8 to 3.8 -- is not evidence that the new strip is a good light source. It is evidence of how far the old strip had drifted from what it was when the protocols were calibrated. Growers who dismiss replacing a cheap strip with another cheap strip as pointless are ignoring the degradation variable. The question is not what type of strip it is. It is how many months it has been running in a Bangkok grow space.
The gap between a degraded strip and a new strip of the same type
FAQ
Is a full-spectrum LED strip good enough for microgreens in Bangkok?
For post-blackout greening as a short-term supplement, it is adequate. As a primary source across a full cycle, it produces measurable yield deficits. In 14 paired sunflower cycles at matched 5,000 lux, trays under a cheap white LED strip showed cotyledon development 31% slower and stem diameter 18% narrower than trays under Bangkok east-window light. The CRI rating describes human colour rendering, not photosynthetically useful red wavelength output. Red content at 640 to 680 nm from a cheap strip runs at approximately 40% of window light at matched lux -- and that figure continues to drop across the strip's operating life. Plant Mood grow log data, 2024.
What AS7341 ratio should I target for growing microgreens?
The (F7+F8)/(F1+F2) ratio above 0.60 consistently correlates with adequate red wavelength delivery for cotyledon chlorophyll accumulation in logged sunflower cycles. Below 0.35 produces outcomes indistinguishable from cheap LED strip exposure. Cool-season Bangkok window light in the 9am to 3pm productive window reads 0.67 to 0.84. A mid-range horticulture panel reads 0.45 to 0.60. A cheap white LED strip reads 0.24 to 0.26 when new and declines to 0.17 or below by month 6 under Bangkok conditions. The F8 channel expressed as a percentage of the clear channel below 25% is the single most diagnostic red-deficit indicator the sensor produces. Plant Mood sensor log data, 2024.
When should I replace my LED grow strip based on spectrum degradation?
Replace when the AS7341 F8 channel drops below 15% of the clear channel reading, or when the (F7+F8)/(F1+F2) ratio falls below 0.20. In Bangkok grow spaces at 16 hours per day, this threshold is typically reached around month 4 of continuous operation -- earlier if most of the operating period falls in hot season when strip surface temperatures of 45 to 50 degrees Celsius accelerate phosphor degradation by approximately 60% versus cool season rates. Do not wait for the lux reading to signal the change. In our 6-month trial, lux had dropped only 11% when F8 had already declined 31%. The lux meter will not tell you. Plant Mood sensor log data, 2024.
What are the best hours to use window light for microgreen post-blackout greening in Bangkok?
In cool season, the spectrally productive window on an east-facing Bangkok window runs from approximately 9am to 3pm -- about 6.5 hours where the (F7+F8)/(F1+F2) ratio exceeds 0.60. In hot season, haze compresses this to approximately 10am to 2pm. Hours before 9am and after 3:30pm deliver a spectrum comparable to a cheap LED strip at low intensity. In paired cycles, 9am to 4pm exposure produced cotyledon colour scores within 0.2 points of 6am to 4pm exposure despite 3 fewer total hours. The early morning hours count in a lux-hour log. They do not count proportionally toward cotyledon chlorophyll accumulation. Plant Mood sensor log data, 2024.
Why do my microgreens look pale even though they greened quickly after blackout removal?
Fast initial greening and deep final cotyledon colour are driven by different processes. Protochlorophyllide reduction -- the first step that produces the yellow-to-pale-green transition -- responds to light intensity more than spectral quality. A bright blue-heavy LED strip can initiate greening as fast as window light at the same lux. The subsequent chlorophyll accumulation step, which produces deepening from pale green to dark green over days 3 through 6, is where red wavelength availability becomes rate-limiting. In 8 paired cycles at identical lux, greening initiation time was within 2 hours between a cheap LED strip and cool-season window light. Final colour score at harvest diverged to 2.6 versus 4.3. The speed of greening predicted nothing about the depth of greening. Plant Mood grow log data, 2024.
Does adding more LED hours fix pale microgreen cotyledons from a red-deficient light source?
No. Adding more hours under a red-deficient source adds more photons of the wrong distribution. In cycles where supplemental LED hours were added on overcast days, trays sometimes performed worse than unsupplemented overcast-day trays because the LED strip amplified the blue dominance of an already blue-skewed diffuse sky. The correct response to pale cotyledons from a red-deficient source is to change the source, not to extend the hours under the same source. If the tray is on day 3 post-blackout or earlier, switching to a higher-ratio source can recover a significant portion of the colour deficit with a 36 to 54 hour response lag. After day 5, the intervention window has largely closed. Plant Mood sensor log data, 2024.
Is a north-facing window adequate for microgreens in a Bangkok apartment?
Adequate for lux at midday, but spectrally capped relative to an east or south-facing window. A north-facing Bangkok window receives only diffuse sky throughout the day with no direct solar incidence. AS7341 (F7+F8)/(F1+F2) readings ranged from 0.35 to 0.47 across the full day, compared to 0.31 to 0.84 for the east-facing window. The north window's best reading at 0.47 sits below the east-facing window's 9am value. The spectral ceiling for a north-facing window never reaches the levels an east-facing window delivers in its productive hours. The case for supplemental artificial lighting -- specifically a horticulture panel with designed red output -- is stronger for north-facing apartments than for east-facing ones. Plant Mood sensor log data, 2024.