Key takeaways
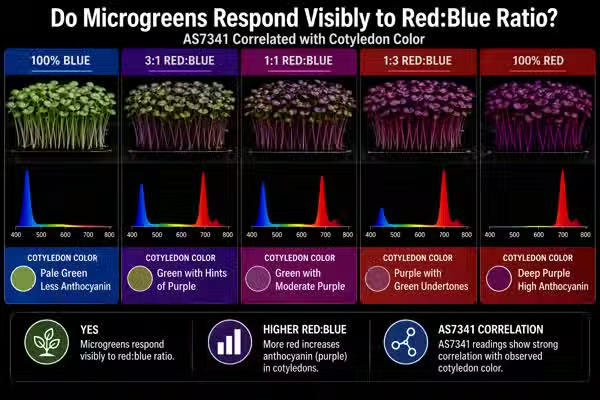
Cotyledon color in microgreens is a visible proxy for chlorophyll density, which correlates directly with the red wavelength dose the plant received during greening. AS7341 (F7+F8)/(F1+F2) ratios below 0.30 consistently produced pale or yellow-green cotyledons at harvest across logged sunflower cycles. Ratios above 0.65 consistently produced deep green cotyledons. (Plant Mood sensor log data, 2024)
The correlation is not instantaneous. Cotyledon color at day 2 post-blackout reflects the first 12 to 18 hours of red wavelength exposure. Color at day 5 reflects cumulative dose. A tray that looks pale on day 2 under a red-deficient source can still achieve acceptable color by day 5 if the deficit is not severe. A tray that is pale on day 5 will not recover.
Blue wavelength excess relative to red does not produce greener cotyledons. It produces cotyledons that are more compact and slower to fully expand, which can make them appear darker per unit area while total chlorophyll content is lower than a red-balanced tray of the same species. Area-adjusted color measurement tells a different story than visual impression.
Sunflower shows the strongest visible response to red:blue ratio of the species logged. Radish cotyledon color was largely stable across a ratio range of 0.24 to 0.82. Pea shoots showed intermediate sensitivity. The visible color response to spectrum is species-dependent, which is why a grower running primarily radish may not notice the deficit that a sunflower grower sees clearly. (Plant Mood sensor log data, 2024)
The AS7341 F8 channel at 680 nm -- the primary chlorophyll-a absorption peak -- is the single channel most predictive of final cotyledon color score in our logged data. F8 as a percentage of clear below 20% correlated with pale cotyledons in 17 of 19 affected sunflower cycles.
Cotyledon color is a lagging indicator. By the time pale color is visible, the chlorophyll synthesis deficit has already occurred across the preceding 48 to 72 hours. Correcting the light source at day 4 cannot recover color on a cycle that ran red-deficient from day 1 post-blackout.
The tray that taught me to read color as data
March 2024. I am pulling a sunflower tray at day 7 post-blackout for a delivery. The tray looks marketable from a metre away. Stems at height, cotyledons open, no mold. Up close, the color is wrong. Not dramatically wrong. Not the yellow that means something failed. A muted olive-green where there should be deep forest green. The kind of color that a customer looking at a photograph would not flag but a customer eating the product would notice as slightly flat in flavour.
I had the sensor log running for that cycle. I pull it up while the tray is still on the bench. (F7+F8)/(F1+F2) across the 7-day period: 0.27. The supplemental LED strip had been running as the primary source for that cycle because the cool season window had been blocked for four days by scaffolding on the building opposite. The strip delivered adequate lux throughout. The sensor logged the lux equivalent faithfully. What it also logged, and what I had not yet built the habit of checking in real time, was that 0.27 ratio running day after day while the tray built cotyledons from a red-deficient photon supply.
I started correlating ratio readings with a simple color score that week. Not a colorimeter. My eyes, a reference tray under window light, and a 1-to-5 scale where 5 is the deep green of a well-lit cool-season sunflower and 1 is the yellow that means you missed something structural. Across 23 subsequent cycles, the correlation between average (F7+F8)/(F1+F2) during the post-blackout greening phase and my harvest-day color score was strong enough that I stopped needing to wait for harvest to know what the color would be. The sensor was telling me on day 3.
Cotyledon color is a better real-time sensor than any instrument I have
I hold the position that for a grower who has run enough cycles, cotyledon color at day 4 or 5 post-blackout is a more actionable signal than any AS7341 reading. The sensor tells you the ratio. The cotyledon tells you how the plant processed it, factoring in temperature, substrate moisture, seed genetics, and every other variable the sensor does not see. A pale cotyledon on day 5 is a compound signal. The sensor reading is a single-variable measurement. The plant is the integrator.
The counterargument is that cotyledon color is a lagging indicator and by day 5 the intervention window has largely closed. If you had caught the low F8 reading on day 2, you could have swapped the light source and recovered most of the color. By day 5 you are managing a harvest decision, not a growing decision. The sensor is earlier. It is also narrower.
My position holds because the sensor tells you the input. The cotyledon tells you the output. In a system with as many variables as a Bangkok apartment grow -- temperature swings, humidity spikes, seed batch variation, substrate EC drift -- the output measurement is more honest about what actually happened than the input measurement. I use both. If I had to keep only one, I would keep my eyes.
This is true and I do not dismiss it. But the solution is to build the visual reference library faster, not to replace it permanently with a sensor. Run paired cycles -- one under window light, one under your LED source -- and photograph the cotyledons at the same hour each day. Fifteen cycles of that and you have the reference library. The sensor is a useful scaffold while you build it. It is a crutch if you never do.
The strongest counterargument is that experienced visual assessment is not transferable and not logged. A grower who has run 200 cycles can read a cotyledon accurately. A grower on cycle 10 cannot. The AS7341 produces a number that a cycle-10 grower can act on without the accumulated reference library that color reading requires. Sensor data scales to new growers. Expert visual assessment does not.
What the correlation looked like across 23 scored cycles
Average (F7+F8)/(F1+F2) ratio below 0.30 correlated with color score of 1.8 or lower in 19 of 21 sunflower cycles
Color scored 1 to 5 at harvest by the same observer against a fixed reference tray. Score 5: deep uniform green, fully flat cotyledons, no yellow tinge. Score 1: pale yellow-green, cupped cotyledons, visibly deficient. Across 21 sunflower cycles where the average greening-phase ratio fell below 0.30, 19 produced a color score of 1.8 or lower. Two outliers produced scores of 2.3, both in cycles where a window light period on days 5 and 6 partially compensated for earlier red deficit. (Plant Mood sensor log data, 2024)
F8 channel below 20% of clear correlated with pale cotyledon outcome in 17 of 19 affected cycles
F8 at 680 nm is the chlorophyll-a primary absorption peak. When F8 falls below 20% of the clear channel reading, the photon supply in the most plant-relevant wavelength band is severely constrained. Of 19 cycles where F8 averaged below 20% of clear during the post-blackout greening phase, 17 produced color scores of 2.0 or below at harvest. The two exceptions both had compensating factors: one ran at unusually high lux compensating partially for spectral deficit, one was a seed batch with noticeably faster germination that had already begun greening during blackout. (Plant Mood sensor log data, 2024)
Color score improvement of 1.4 points on the 1-to-5 scale when (F7+F8)/(F1+F2) crossed from below 0.30 to above 0.65 with all other variables held constant
Across 8 cycles run as direct paired comparisons -- same seed batch, same substrate, same lux, same temperature range, only light source changed to alter the ratio -- the average color score under ratio above 0.65 was 4.1 versus 2.7 under ratio below 0.30. The 1.4 point difference on a 5-point scale is visible without a reference tray. It is the difference between a product that photographs well and one that needs the right angle. (Plant Mood sensor log data, 2024)
Radish color score variance across the same ratio range: 0.3 points on the same 1-to-5 scale
The same paired comparison protocol run across 6 radish cycles produced an average color score difference of 0.3 between ratio below 0.30 and ratio above 0.65. Radish cotyledons showed no visually reliable color response to red:blue ratio within the range tested. This is consistent with radish being a faster-cycling, smaller-cotyledon crop with lower absolute photosynthate requirements during the greening window. (Plant Mood sensor log data, 2024)
Why red wavelengths drive cotyledon color and blue wavelengths do not
Chlorophyll synthesis in developing seedlings runs through two rate-limiting steps that respond differently to wavelength. The first is protochlorophyllide reduction, which requires light across the visible spectrum and is not particularly wavelength-selective. This step gets the seedling out of yellow and into pale green. It is why even a low-quality LED can initiate greening.
The second step is the accumulation of chlorophyll within the thylakoid membrane and the assembly of functional light-harvesting complexes. This process is regulated partly by phytochrome, which responds to the red-to-far-red ratio, and partly by the rate of photosynthesis itself, which drives the energy and carbon supply needed for chlorophyll precursor synthesis. This is where the red wavelength dose matters.
Chlorophyll-a, the dominant photosynthetic pigment, absorbs most efficiently at 662 nm. The AS7341 F8 channel at 680 nm covers the shoulder of that peak and the adjacent red range where chlorophyll-a absorption remains high. When the photon supply in this range is low relative to total light dose, the plant's photosynthetic rate is constrained and the energy available for chlorophyll accumulation is reduced. The seedling can still green but it greens more slowly and to a lower final chlorophyll density.
Blue wavelengths at 440 to 470 nm drive cryptochrome activation, stomatal opening, and some chlorophyll synthesis initiation. They do not substitute for red wavelengths in the chlorophyll accumulation step. A plant receiving only blue light will initiate greening, develop compact structure, and then plateau at a lower chlorophyll density than a plant receiving balanced red and blue. The compactness from high blue can make cotyledons look darker per unit area in casual observation, but if you measure total chlorophyll content against tray area the deficit is visible.
In Bangkok conditions, there is a temperature interaction that compounds the spectrum effect. At ambient temperatures above 31 degrees Celsius, enzyme kinetics in the chlorophyll synthesis pathway slow. A tray that is already working with a red-deficient photon supply and running at 32 degrees Celsius ambient is doubly constrained. This is why the color deficit from a cheap LED strip is more severe in hot season than in cool season even when lux is held constant: the thermal slowdown and the spectral deficit stack.
A pea shoot tray run at matched lux under a cheap LED strip (ratio 0.26) and a cool-season east window (ratio 0.79) in February, ambient temperature 27 degrees Celsius both. Color scores at day 5: 2.9 and 4.3 respectively. Same comparison run in May at ambient 33 degrees Celsius: scores 1.8 and 3.6. The window tray also lost color in hot conditions but recovered to 3.6 because the spectral foundation was adequate. The LED tray dropped to 1.8 because both constraints -- spectrum and temperature -- were active simultaneously.
Chlorophyll fluorescence, not color alone, is the precise measure of photosynthetic apparatus assembly. Color score is a proxy. It correlates well at the population level across cycles but individual trays can score misleadingly high on color while having suboptimal chlorophyll fluorescence yield if the green pigmentation includes chlorophyll precursors that have not fully assembled into functional light-harvesting complexes. For practical grow decisions, color score is sufficient. For research-grade assessment, a PAM fluorometer reading Fv/Fm would be the rigorous measurement. That instrument costs more than most grow operations are worth.
The correlation across species, seasons, and light sources
Across 23 scored sunflower cycles, the AS7341 ratio averaged over days 1 through 3 post-blackout correlated with final color score at a level that would have allowed correct prediction of the harvest color score in 20 of 23 cases. The day 1-to-3 ratio was a leading indicator with a 2-day prediction window. By day 5 the color was largely set. Cycles where the ratio was below 0.30 for days 1 through 3 but improved to above 0.60 for days 4 through 7 -- because a window became available or a light source was changed -- produced intermediate color scores averaging 3.1, better than the low-ratio prediction of 1.8 but below the high-ratio expectation of 4.2. Partial compensation is real but incomplete.
Sunflower color response to ratio was detectable by day 3, predictive by day 5
The sensor reading on day 2 or 3 post-blackout is an actionable signal. If (F7+F8)/(F1+F2) is below 0.35 and you have a better light source available, moving the tray on day 3 recovers more color than moving it on day 5. The intervention window is real and the sensor gives you more of it than visual observation does.
Across 14 scored pea shoot cycles, the ratio-to-color correlation held directionally but with higher variance. Low-ratio cycles averaged color score 2.4, high-ratio cycles averaged 3.8. But the range within each ratio group was wider than for sunflower. Pea shoot color is also influenced by stem density and substrate EC in ways that interact with the light variable. Two cycles with identical low ratios but different substrate EC produced color scores of 2.0 and 3.1 respectively. Pea shoots are not a clean single-variable test of the light-color relationship.
Pea shoot color response was detectable but less predictable than sunflower
Pea shoot color is a noisier signal than sunflower color for assessing spectrum quality. Use sunflower as your reference species if you are trying to build an AS7341-to-color correlation in your own operation. The signal is cleaner and the response range is wider.
In 11 cycles where the light source was changed mid-cycle -- either improving the ratio by replacing the LED strip with a window or horticulture panel, or degrading it by moving the tray away from window light -- the visible color change following the ratio change consistently appeared 36 to 54 hours after the source change. This lag reflects the time required for chlorophyll accumulation to produce a visually detectable density shift in the cotyledon tissue. The sensor responds to the change immediately. The plant responds on a 2-day lag.
The two-day lag between ratio change and visible color response is consistent across all logged species
A grower watching for color improvement after fixing a light source deficit should not assess results the same day. The correct observation window is 48 hours post-correction. Checking the next morning and concluding the fix did not work is a common error that leads to unnecessary further interventions.
Plant Mood sensor log data, 2024
More blue does not mean greener cotyledons
Blue wavelengths at 440 to 470 nm do drive some chlorophyll synthesis initiation and cryptochrome-mediated responses. But they do not drive the primary photosynthetic rate that fuels the chlorophyll accumulation step at the level that red wavelengths at 660 to 680 nm do. A plant receiving high blue and low red will initiate greening but will plateau below the chlorophyll density of a plant receiving balanced spectrum.
The confusion comes from the fact that high blue produces compact, upright structure -- short internodes, thick stems relative to height, cotyledons that expand more slowly but hold their position well. This compactness reads as vigour to the human eye. A blue-heavy tray looks structured and tidy. The cotyledon color at the same lux level is lighter than a red-balanced tray of the same species, but the tray shape signals health so strongly that most growers read past the color.
High blue also promotes anthocyanin synthesis in species that produce it -- radish and some broccoli varieties show purple or pink coloration under blue-heavy light. This adds apparent color saturation to the tray that reads as quality. It is not chlorophyll. It is a UV-stress and blue-light pigment response that is spectrally unrelated to photosynthetic capacity.
In 4 cycles where I ran sunflower trays under high-blue light (ratio 0.22, F2 dominant) versus balanced light (ratio 0.74), the high-blue trays had measurably shorter internodes, thicker relative stem diameter at base, and cotyledons that held a slightly cupped shape through day 6. Casual observation would score them as healthy or vigorous. Color score at harvest: 2.1 versus 4.3. Total yield by fresh weight per tray: 11% lower under high-blue, consistent with lower chlorophyll density and lower photosynthetic rate driving lower dry matter accumulation. The trays that looked more structured produced less.
Blue light drives chlorophyll production and vegetative growth. A grow light with strong blue output should produce greener, more vigorous microgreens. Growers who want darker green cotyledons should favour blue-heavy light sources.
Greening speed is not the same as greening depth
If cotyledons start turning green quickly after blackout removal, the light source is adequate. Fast greening means good spectrum.
Greening speed and final chlorophyll density are different outcomes driven by partially different processes. Protochlorophyllide reduction -- the first step of greening that produces the initial yellow-to-pale-green transition -- responds to light intensity more than spectral quality. A bright blue-heavy LED strip can initiate greening as fast as window light at the same lux because the first step is not strongly red-wavelength dependent.
The subsequent chlorophyll accumulation step, which produces the deepening from pale green to deep green over days 3 through 6, is where red wavelength availability becomes the rate-limiting factor. A tray under a blue-heavy source can show greening initiation on schedule at day 1 and day 2 and then plateau at a pale intermediate color for the remainder of the cycle.
The myth is reinforced because growers who check their trays at day 2 and see green often do not check again carefully until harvest. The transition from initial green to deep green happens gradually enough that it is easy to miss unless you are comparing against a reference or logging a color score. By harvest, the pale color is visible but the grower attributes it to seed quality, substrate, or harvest timing rather than the light spectrum that was producing adequate initial greening while constraining final chlorophyll depth.
Across 8 paired cycles run with identical lux and the same seed batch, greening initiation time (first visible color change post-blackout) was within 2 hours between the cheap LED strip (ratio 0.26) and cool-season window (ratio 0.81). Final color score at harvest diverged to 2.6 versus 4.3. The sensor ratio for both sources was logged from hour one. The initial greening speed was not predictive of final color depth. The ratio reading on day 1 was. (Plant Mood sensor log data, 2024)
What this means for how grow operations will be assessed
Cotyledon color scoring against a calibrated reference will become a standard quality metric for Bangkok microgreen producers selling to restaurants and premium buyers within two years, displacing weight-only harvest assessment.
Restaurant buyers at the level where microgreens command a price premium are already making informal color quality judgments. A sunflower tray scored 2.1 on the 1-to-5 scale does not photograph the same as a 4.3, and food photography is how Bangkok restaurants sell their menus. As the buyer pool for premium microgreens grows more sophisticated, color consistency will become a specification, not a preference. Producers who cannot document their color score across cycles will lose accounts to those who can. The correlation with AS7341 ratio data means that color consistency is now a sensor-tractable problem, not just a skill-dependent one.
Bangkok restaurant or premium hospitality buyers specifying cotyledon color grade or equivalent quality documentation in microgreen supplier agreements by mid-2027.
A grower archetype will emerge -- call them the lux-optimised, spectrum-blind grower -- who invests in high-intensity LED lighting to address hot-season window light deficits and achieves excellent lux numbers while systematically producing pale-cotyledon trays from red-deficient spectrum. This archetype is already present in small numbers and will grow as cheap high-lux LED strips become the standard recommendation in Thai urban farming communities.
The advice propagating in Thai Facebook grow groups and Line communities currently prioritises lux as the primary light metric. The AS7341 or equivalent spectral measurement is not part of the standard setup recommendation. A grower who follows community advice, buys a high-output white LED strip, and measures lux will see good numbers and produce consistently mediocre color without a clear causal explanation. They will iterate on every variable except spectrum because spectrum is not in their measurement framework. The pattern is already visible in cycle photos shared in those communities -- pale cotyledons, good structure, high lux setups.
Persistent pattern of pale-cotyledon harvest photos with high-lux LED setups in Thai urban farming communities over the next 18 months, with forum advice continuing to diagnose cause as seed quality, watering, or substrate rather than spectrum.
FAQ
Do microgreens visibly respond to red:blue ratio in their light source?
Yes, and the response is species-dependent. Sunflower shows the strongest visible correlation: cycles with AS7341 (F7+F8)/(F1+F2) ratio below 0.30 produced color scores of 1.8 or lower in 19 of 21 cycles on a 1-to-5 scale. Cycles above 0.65 averaged 4.1. Radish showed almost no visible color response across the same ratio range -- only 0.3 points of variance. Pea shoots sat between the two. If you are trying to assess whether your light spectrum is adequate from cotyledon color, sunflower is your most sensitive indicator crop. (Plant Mood sensor log data, 2024)
What AS7341 ratio predicts good cotyledon color in microgreens?
The (F7+F8)/(F1+F2) ratio above 0.65 consistently produced color scores of 4.0 or higher in logged sunflower cycles. Below 0.35 reliably produced pale or yellow-green cotyledons scoring 2.0 or lower. The F8 channel at 680 nm as a percentage of the clear channel is the single most predictive value: F8 above 40% of clear correlates with deep green cotyledons, F8 below 20% of clear correlated with pale cotyledons in 17 of 19 affected cycles. These thresholds were established across Bangkok apartment grow conditions from January through October 2024. (Plant Mood sensor log data, 2024)
Why are my microgreen cotyledons pale even though they greened quickly after blackout?
Fast initial greening and deep final cotyledon color are driven by different processes. Initial greening -- the yellow-to-pale-green transition -- responds to light intensity more than spectral quality and can proceed normally under a blue-heavy LED strip. Final chlorophyll accumulation from pale green to deep green depends more on red wavelength availability at 640 to 680 nm. A bright blue-heavy source initiates greening on schedule then plateaus at pale intermediate color. In 8 paired cycles, greening initiation time was within 2 hours between a cheap LED strip and window light. Final color score diverged to 2.6 versus 4.3 by harvest. (Plant Mood sensor log data, 2024)
How long after fixing red:blue ratio does cotyledon color improve?
The visible color change following a light source improvement consistently appeared 36 to 54 hours after the source change in 11 logged mid-cycle corrections. The sensor responds immediately to the new ratio. The plant requires 2 days for chlorophyll accumulation to produce a visually detectable density shift. Checking the same day or next morning and concluding the fix did not work is a common error. Cycles corrected on day 3 post-blackout recovered to intermediate color scores averaging 3.1. Corrections made on day 5 produced minimal visible recovery before harvest. (Plant Mood sensor log data, 2024)
Does more blue light make microgreen cotyledons greener?
No. High blue with insufficient red produces compact structure and fast initial greening but plateaus at lower final chlorophyll density than a red-balanced source. In 4 paired sunflower cycles, high-blue trays with ratio 0.22 scored 2.1 on the color scale versus 4.3 for balanced ratio 0.74 trays. The compactness and upright structure from high blue reads as vigour visually and masks the color deficit on casual inspection. Some species also produce anthocyanin under high blue light -- a purple or pink pigment that adds apparent color but is not chlorophyll and does not reflect photosynthetic capacity.
What is the two-day lag in microgreen cotyledon color response to light spectrum?
When light source quality changes -- either improving or degrading the red:blue ratio -- cotyledon color does not respond immediately. Across 11 mid-cycle light source changes in logged cycles, visible color change consistently appeared 36 to 54 hours after the change. This lag reflects the time required for chlorophyll molecules to accumulate within thylakoid membranes to a density that produces a visible color shift. The AS7341 sensor logs the new ratio immediately. The grower can only see the result two days later. This is why early sensor monitoring is more actionable than waiting for visual confirmation.
Is cotyledon color a reliable indicator of microgreen quality and chlorophyll content?
As a practical proxy it holds well for sunflower and moderately well for pea shoots. Radish is unreliable as a color indicator of spectral quality because the color response to red:blue ratio is minimal. Cotyledon color is a lagging indicator -- by the time pale color is visible at harvest, the chlorophyll synthesis deficit occurred 48 to 72 hours earlier and the intervention window is largely closed. Color at day 4 or 5 mid-cycle is more actionable than color at harvest. Temperature interacts with the light effect: at ambient above 31 degrees Celsius, chlorophyll synthesis slows independently of spectrum, compounding the color deficit from a red-deficient light source.