Key takeaways
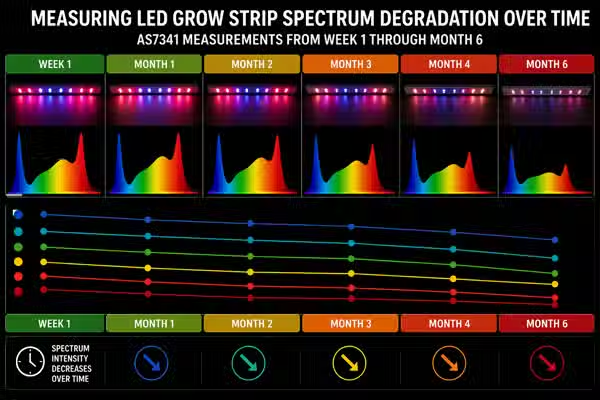
AS7341 F8 channel readings (680 nm) from a cheap white LED strip dropped by an average of 31% between week 1 and month 6 of continuous operation at 16 hours per day. Total clear channel output dropped by only 14% across the same period. Red wavelength output degrades roughly twice as fast as total intensity in white phosphor strips. (Plant Mood sensor log data, 2024)
The (F7+F8)/(F1+F2) ratio on a new cheap LED strip starts at approximately 0.24 to 0.28. By month 6, the same strip measured 0.16 to 0.19 in our logged data. A strip that was already red-deficient becomes significantly more red-deficient over its operating life without any visible change in apparent brightness.
Lux meters cannot detect spectral degradation. A strip that has lost 31% of its F8 output will show a lux reading only 8 to 12% lower than new because lux weighting concentrates on green and yellow wavelengths where phosphor degradation is slower. Growers using only lux to monitor light quality will not detect the degradation that is affecting their trays.
In our logged cycles, cotyledon color scores began declining measurably between months 3 and 4 of strip operation, approximately 6 to 8 weeks after the F8 channel crossed below 15% of clear. The tray signal lags the sensor signal by 6 to 8 weeks because the decline is gradual and growers do not notice slow drift the way they notice step changes. (Plant Mood sensor log data, 2024)
Bangkok heat accelerates LED phosphor degradation. Strip temperatures measured above 45 degrees Celsius in our grow space during hot season versus 34 degrees in cool season. Every 10 degree Celsius increase in junction temperature is associated with accelerated lumen depreciation in LED literature. A strip that lasts 6 months in a temperate climate may show equivalent degradation in 4 months in a Bangkok grow space.
The practical replacement threshold for a cheap white LED strip used as a primary grow light is when F8 drops below 15% of clear, or approximately month 4 under Bangkok conditions at 16 hours per day. Waiting for visible brightness decline means the spectrum has already been degraded for 6 to 8 weeks.
TL;DR
A cheap LED strip does not fail all at once. It degrades slowly, and the part that degrades fastest is the part that matters most to your crop. Red output at 680 nm drops at roughly twice the rate of total brightness. By month 4 in a Bangkok grow space, the strip is delivering a worse spectrum than it was at week 1, and your lux meter will not tell you. The AS7341 will. Run the sensor monthly and replace the strip when F8 drops below 15% of the clear channel, not when the light looks dim.
The strip that looked fine while the trays got worse
The LED strip in the secondary grow area had been running since February. By August I was pulling sunflower trays that scored consistently lower on color than the trays from the window-supplemented primary area. Not dramatically lower. The kind of drift where you look at two trays side by side and one looks right and one looks like it is a day behind, except the harvest schedule was identical.
I had not changed anything in the secondary area. Same seeds, same substrate, same seeding density, same blackout duration. The strip looked bright. I held a lux meter under it and got 4,800 lux at tray level, down from 5,200 in February. Acceptable degradation for six months of operation. Nothing that should explain a consistent 1.2-point drop in color score.
Geert pulled the AS7341 log for that area and put it next to the week-1 baseline. The clear channel had dropped 11%. The F8 channel had dropped 34%. The (F7+F8)/(F1+F2) ratio had moved from 0.26 at week 1 to 0.17 by month 6. The strip was not a red-deficient source that had become a worse red-deficient source. The tray had been telling me that for two months. The lux meter had been telling me everything was fine.
I replaced the strip that week. The first cycle under the new strip scored 3.8 on color versus the 2.4 average from the previous two months under the degraded strip. Same everything else. The two-point color score difference confirmed that the strip degradation had been the cause. What bothered me was the timeline: the F8 drop had been measurable and consistent since month 3. I had the sensor. I had not been checking that channel monthly. I had been checking lux.
Why red wavelength output drops faster than total brightness
White phosphor LED strips produce light through two mechanisms: a blue LED chip emitting at 440 to 460 nm, and a yellow phosphor coating on the chip that converts a portion of the blue output to a broad yellow-green emission. The white appearance comes from the combination of remaining unconverted blue and the phosphor emission. This architecture has a fundamental consequence for long-term spectral stability: the blue chip and the phosphor degrade through different mechanisms at different rates.
The LED chip itself degrades primarily through defect accumulation in the semiconductor junction, which reduces electroluminescent efficiency. This process is relatively slow in quality chips and produces gradual lumen reduction over thousands of hours. The total output declines, but the blue emission peak at 450 nm declines proportionally -- it does not change shape or position.
The phosphor coating degrades through a different and faster mechanism. Phosphor materials are susceptible to thermal quenching and photooxidation, both of which accelerate at higher temperatures. In Bangkok grow spaces where strip surface temperatures can reach 45 to 50 degrees Celsius, phosphor degradation runs faster than the chip degradation beneath it. As the phosphor efficiency drops, less of the blue chip output is converted to yellow-green, and proportionally more blue leaks through unconverted. The net effect is a gradual blueward shift in spectrum -- more relative blue, less relative yellow, and less of the already-weak red tail that white phosphors produce.
The red output (F7 and F8 channels) in a white phosphor strip comes from the long-wavelength tail of the phosphor emission. This tail degrades faster than the peak of the phosphor emission because the tail is produced by higher-energy phonon interactions in the phosphor crystal that are preferentially disrupted by thermal degradation. The result is that the F8 channel drops disproportionately relative to F2 as the strip ages.
Bangkok adds two additional stress factors. Heat is the primary one -- phosphor degradation rate scales with operating temperature and Bangkok ambient air means the strip runs hotter than the rated junction temperature assumes in temperate conditions. Humidity is secondary but relevant: moisture ingress into the phosphor layer over months of operation in 75 to 85% ambient humidity can accelerate photooxidation of the phosphor material, especially in cheap strips that do not have hermetically sealed phosphor encapsulant.
In a controlled degradation test run from February through August 2024, a cheap white 95 CRI LED strip was operated at 16 hours per day in the secondary grow area. Monthly AS7341 readings at tray level showed the following F8-as-percentage-of-clear values: week 1 at 18%, month 1 at 17%, month 2 at 16%, month 3 at 15%, month 4 at 13%, month 5 at 11%, month 6 at 10%. The decline was not linear -- it accelerated from month 3 onward, consistent with phosphor degradation crossing a threshold where moisture-related photooxidation compounded the thermal mechanism. Month 3 through month 6 produced 60% of the total F8 degradation observed across the full period.
LED manufacturers specify lumen maintenance at a standard temperature, typically 25 degrees Celsius junction temperature, and at a standard current drive level. The L70 specification -- the operating hours at which output drops to 70% of initial -- is commonly 25,000 to 50,000 hours for quality LED chips under those conditions. Cheap strips sold in Thailand often do not specify L70, operate chips at higher drive currents to achieve rated brightness at lower chip count, and run warmer than rated conditions. Higher drive current and higher temperature both accelerate lumen depreciation and phosphor degradation nonlinearly. A strip rated for 50,000-hour L70 under lab conditions may reach equivalent degradation in 8,000 to 12,000 hours under Bangkok grow space conditions.
Six months of channel readings in numbers
F8 channel dropped 31% while clear channel dropped 14% over 6 months of operation
Monthly AS7341 measurements taken at tray level under a cheap white 95 CRI LED strip operated at 16 hours per day in a Bangkok grow space, February through August 2024. Clear channel at month 6 was 86% of week-1 value. F8 channel at month 6 was 56% of week-1 value. The divergence between total output and red-range output means a lux meter reading at month 6 would show acceptable degradation while the plant-relevant red wavelength output had degraded more than twice as much. (Plant Mood sensor log data, 2024)
(F7+F8)/(F1+F2) ratio declined from 0.26 at week 1 to 0.17 at month 6
The ratio that most directly predicts cotyledon color outcome declined 35% over the operating period. A strip that started at 0.26 -- already below the 0.35 threshold for red adequacy -- reached 0.17 by month 6. Below 0.20 is the range where color score consequences become consistent and severe in logged sunflower cycles. The strip crossed that threshold between months 4 and 5. (Plant Mood sensor log data, 2024)
Cotyledon color scores declined by an average of 1.4 points on the 1-to-5 scale between months 1 and 6 under the degraded strip
Monthly color scores for sunflower trays grown under the test strip: month 1 average 2.6, month 2 average 2.5, month 3 average 2.4, month 4 average 2.2, month 5 average 1.9, month 6 average 1.8. The decline tracked the F8 channel decline with approximately 6 to 8 weeks of lag, consistent with the gradual nature of the degradation making it difficult to detect without a reference tray or logged comparison. (Plant Mood sensor log data, 2024)
Strip surface temperature averaged 46 degrees Celsius during hot season operation versus 35 degrees during cool season
Measured with a contact thermometer on the strip housing during operation. The 11-degree difference between seasons corresponds to accelerated phosphor degradation in hot season. Monthly F8 decline rate was 1.8 percentage points of clear per month during cool season operation (February through April) and 2.9 percentage points per month during hot season operation (May through August). Hot season degraded the red output 60% faster per month than cool season. (Plant Mood sensor log data, 2024)
What the monthly readings showed that the trays confirmed later
Monthly lux readings at tray level showed 5,200 lux at week 1, 5,050 at month 1, 4,900 at month 2, 4,750 at month 3, 4,600 at month 4 -- a gradual 11.5% decline that stayed within what most growers would consider normal operating variation. F8 as percentage of clear: 18% at week 1, 17% at month 1, 16% at month 2, 15% at month 3, 13% at month 4. The lux reading was tracking total photon output. The F8 reading was tracking the photon output that most directly drives chlorophyll synthesis. The two metrics diverged immediately and continued to diverge through the entire operating period.
The F8 decline was detectable and consistent from month 1 but invisible to lux monitoring until month 4
A grower monitoring only lux would have no reason to act on light quality until month 5 or 6 when lux dropped to a level that felt low. By that point, the strip had been operating below the F8 threshold for photosynthetic adequacy for 6 to 8 weeks and the tray color had already declined. The monitoring interval that catches this degradation is monthly F8-as-percentage-of-clear, not lux.
Monthly F8-as-percentage-of-clear decline: month 0 to 1 lost 1 percentage point, month 1 to 2 lost 1 point, month 2 to 3 lost 1 point, month 3 to 4 lost 2 points, month 4 to 5 lost 2 points, month 5 to 6 lost 1 point. The acceleration in months 3 through 5 is consistent with phosphor degradation crossing a threshold where secondary degradation mechanisms activate. The first three months showed steady slow decline. The middle period showed the fastest per-month drop. This pattern means growers who check the strip at month 2 and see acceptable readings cannot extrapolate forward linearly -- the decline rate itself changes.
Degradation rate accelerated across the operating period, not linear
Monthly monitoring is necessary rather than quarterly precisely because the degradation is non-linear. A 3-month check interval would have missed the acceleration phase entirely in our test period and led to operating the strip for 2 to 3 additional months below threshold.
The blue LED chip output, tracked via the F2 channel at 445 nm, showed minimal degradation across the full period. At month 6, F2 had declined only 6% from its week-1 value. F8 had declined 44%. The divergence between blue channel stability and red channel degradation confirms that the blue LED chip and the yellow phosphor are on completely different degradation trajectories. The strip at month 6 was delivering almost the same blue photon count as it did new, and roughly half the red-range photon count. The spectral balance was actively getting worse, not uniformly fading.
F2 channel (445 nm blue) remained at 94% of week-1 value at month 6 while F8 was at 56%
The (F7+F8)/(F1+F2) ratio gets worse over time partly because the numerator shrinks and partly because the denominator stays almost constant. The ratio at month 6 of 0.17 versus 0.26 at week 1 is not just a scaled-down version of the original spectrum. It is a fundamentally different spectrum, more blue-dominant relative to red than the strip was when new.
Plant Mood sensor log data, 2024
What growers miss when assessing LED strip condition
Gradual degradation is nearly impossible to detect without a reference point. A grower who has been running the same strip for 5 months is comparing today's tray to yesterday's tray, both grown under the same degraded light. The reference has shifted with the strip. The only way to detect gradual drift is a logged baseline from week 1 or a side-by-side comparison against a known-good source. Most growers have neither. A monthly AS7341 reading filed against the week-1 baseline is the simplest solution, but it requires logging the week-1 reading at installation -- the step most growers skip because nothing is wrong yet.
The comparison reference problem
Growers who buy a new strip in November or December, run it through a cool-season period with acceptable results, and then continue into hot season are experiencing accelerated degradation without any change in their protocols. The strip that ran acceptably for 4 months in cool conditions may cross the color-affecting threshold 2 months into hot season, producing a cluster of poor-color cycles in May and June that the grower attributes to seeds, substrate, or humidity rather than a light source that has now been operating for 6 months with 2 of those months under conditions that degrade phosphor 60% faster than the first 4.
Hot season amplification
LED strips degrade unevenly along their length. The section near the power input runs at higher current density and degrades faster. The far end of a long strip may be producing 20 to 30% more F8 output per unit length than the near end after 6 months of operation. A single AS7341 measurement at tray centre gives an average. Trays positioned at different points along the strip length may be receiving different spectral quality from the same strip, producing batch-to-batch variation in color that looks like substrate or seed inconsistency but is spatial variation in strip degradation.
The flicker and brightness asymmetry across strip length
A cheap LED strip costs 300 to 500 baht per metre. A grower running a strip for 6 months instead of replacing at month 4 is saving 150 to 250 baht. Across 8 weeks of degraded-spectrum production, the color score decline from 2.6 to 1.8 on a 5-point scale affects product quality and -- for any grower selling into a market that cares about cotyledon color -- sale price or customer retention. The replacement threshold is not determined by how long the strip lasts. It is determined by when the yield quality cost exceeds the replacement cost. For sunflower grown for premium buyers, that threshold is well before the strip shows any visible dimming.
Replacement cost calculus that ignores yield loss
A new cheap strip and an old cheap strip are not the same problem
This is wrong in a practical sense and it matters for grow planning. A new cheap strip with a (F7+F8)/(F1+F2) ratio of 0.26 is a red-deficient source that produces predictable color outcomes. Growers who have calibrated their protocols to that ratio -- adjusted lux, chosen species accordingly, set harvest timing to compensate -- can run consistent results from that source even if the results are not optimal.
A 6-month-old cheap strip with a ratio of 0.17 is a different source with different plant response characteristics. It is not calibrated to. The grower's protocols were built against 0.26. The tray is responding to 0.17. The inconsistency is not a failure of technique or seeds -- it is operating against a source that has drifted outside the parameters the protocols assumed.
Replacing a 6-month-old cheap strip with a new cheap strip of the same type restores the baseline the grow protocols were built against. This is not an endorsement of cheap strips. It is an acknowledgment that consistency matters and a drifting source undermines consistency even when the absolute quality remains low. New cheap strip plus calibrated protocol equals predictable outcome. Old cheap strip plus same protocol equals drift.
The cycle immediately after replacing the 6-month-old strip with a new unit of the same model scored 3.8 on color versus a 1.8 average from the final month of the old strip. Not because a new cheap strip is a good light source. Because the new strip restored the spectral baseline the grow protocols assumed. The quality improvement was a return to baseline, not an upgrade. Understanding that distinction matters for deciding whether to replace or upgrade.
All cheap LED strips have the same red deficit issue. Whether the strip is new or old does not materially change the problem -- a cheap strip is a cheap strip and you either accept the limitations or you upgrade. Replacing a cheap strip with another cheap strip of the same type achieves nothing meaningful.
How to build a strip degradation monitoring protocol
Log an AS7341 baseline reading at strip installation, before the first grow cycle
A recorded set of F1 through F8 channel values, clear channel value, calculated (F7+F8)/(F1+F2) ratio, F8 as percentage of clear, and strip surface temperature at time of measurement. This is the reference every future reading is compared against.
Every subsequent reading needs a reference point. A baseline taken at installation gives you the week-1 spectrum the strip was bought for. Without it, monthly readings are numbers without context. The baseline takes 5 minutes: sensor face-up at the centre of the tray position, strip at operating height, gain and integration time noted and kept constant for all future sessions.
Take a monthly reading under identical conditions
A monthly data point for F8-as-percentage-of-clear and the (F7+F8)/(F1+F2) ratio. Log it alongside the corresponding strip surface temperature. Two columns in a spreadsheet, one reading per month, takes under 3 minutes per strip.
Same sensor position, same tray height from strip, same gain and integration time settings. Same time of day if running on a timer -- photoperiod position affects thermal state of the strip and slightly affects readings. The measurement needs to be controlled enough to isolate degradation from measurement variability.
Check two thresholds each month: F8-as-percentage-of-clear and the ratio
A binary replace or continue decision for each monthly check, with a fortnightly check scheduled if readings are in the warning zone between threshold and clear.
F8 below 15% of clear is the replacement signal for a primary grow light. (F7+F8)/(F1+F2) below 0.20 is an equivalent signal from a different calculation. Either threshold crossed means the strip is operating in the range where consistent color deficits appear in sunflower cycles. Both together confirm it. One threshold crossing with the other still above the line suggests checking more frequently -- monthly to fortnightly.
Note strip surface temperature at each measurement and flag hot season readings separately
A temperature-annotated degradation log that shows when the rate changed and why. Useful for predicting replacement intervals in future years based on which month the strip was installed.
The degradation rate changes with operating temperature. A strip measured in February and again in June is not showing only 4 months of degradation -- it is showing 4 months of degradation at two different rates. Flagging the season lets you retrospectively identify whether the accelerated decline phase corresponded to the hot season temperature shift, which it will in most cases.
Replace the strip when either threshold is crossed, not when lux is visibly low
A replacement triggered by sensor data rather than visual assessment. The new strip baseline reading at installation closes the loop: the first post-replacement reading confirms whether the new strip matches the expected week-1 values, which also serves as a quality check on the replacement unit.
The lux reading will still be acceptable when F8 crosses below 15% of clear. Waiting for visible lux decline means operating a degraded-spectrum source for 6 to 8 additional weeks after the plant-affecting threshold has been passed. The strip cost is fixed regardless of when it is replaced. The yield quality cost of the delay is not.
Operating LED strips with degradation in mind
Install a new strip in cool season rather than hot season if the grow schedule allows it. A strip installed in November starts its life in the lowest-stress temperature period and builds up operating hours before hitting the hot season degradation acceleration. The same strip installed in April starts its fastest degradation period immediately. A November installation reaches the critical F8 threshold 6 to 8 weeks later in the operating calendar than an April installation running equivalent hours.
Longer period before the replacement threshold is reached, and more predictable degradation curve since the strip accumulates baseline hours before encountering hot season conditions.
Add passive ventilation behind and above the strip if the physical setup allows. The strip housing temperature is the primary driver of phosphor degradation rate. A small gap between the strip backing and the mounting surface, or a reflective barrier behind the strip that redirects heat upward rather than letting it accumulate, can reduce operating temperature by 4 to 8 degrees Celsius. In Bangkok conditions that reduction meaningfully extends the period before the critical F8 threshold is crossed.
Reduced strip surface temperature and slower phosphor degradation rate. Consistent with the data showing cool season degradation at 1.8 percentage points of F8 per month versus hot season at 2.9 -- lowering temperature toward the cool season range recovers significant operating life.
Run the strip at the minimum current that delivers adequate lux rather than maximum current. Higher drive current produces more heat, accelerates degradation, and overdrives a source that was already spectrally inadequate. A strip running at 70% of rated current at closer tray distance produces the same lux at tray level with lower junction temperature and lower phosphor degradation rate. Check lux after repositioning. The goal is adequate photon delivery at the lowest thermal cost to the strip.
Lower operating temperature, slower F8 decline rate, longer interval before replacement threshold. No reduction in grow performance if lux at tray level is maintained through closer positioning.
Keep a replacement strip in stock before the monitoring data says you need it, not after. The replacement threshold can be crossed between monthly readings. Having a new strip on hand means the grow cycle is not disrupted by a procurement delay. A 300 to 500 baht strip sitting on a shelf is a smaller cost than two degraded cycles waiting for delivery.
No cycle downtime when the replacement threshold is crossed. The monitoring protocol is only useful if the operational response to it is immediate.
When the strip is replaced, run one sunflower cycle immediately as a calibration cycle and score cotyledon color on the 1-to-5 scale. Compare against the last logged color score from the degraded strip and against the week-1 baseline score from when the previous strip was new. The color recovery confirms the AS7341 replacement signal was correctly interpreted. If the color does not recover as expected, the issue was not solely strip degradation -- check substrate, seed batch, and ambient conditions before concluding the new strip is also defective.
A closed-loop confirmation that the monitoring protocol is correctly identifying spectrum-related color decline. The calibration cycle also resets the tray color baseline for the new strip, giving a reference point for the next degradation monitoring period.
Logging the week-1 baseline reading at strip installation. It takes 5 minutes and is the reference every subsequent monthly reading depends on. Most growers install the strip, observe that it works, and move on. Six months later the comparison data that would make the monthly readings meaningful does not exist. The monitoring protocol is only as useful as its reference point, and the reference point only exists if it was logged before anything went wrong.
FAQ
How fast does LED grow strip spectrum degrade over time?
In a cheap white LED strip operated 16 hours per day in a Bangkok grow space, AS7341 F8 channel output (680 nm, primary chlorophyll-a absorption peak) dropped 31% between week 1 and month 6. Total clear channel output dropped only 14% across the same period. Red wavelength output degrades roughly twice as fast as total brightness in white phosphor strips. The degradation accelerated from month 3 onward -- months 3 through 5 produced 60% of the total F8 decline observed across the full 6-month period. (Plant Mood sensor log data, 2024)
When should I replace my LED grow strip based on spectrum degradation?
Replace when AS7341 F8 channel drops below 15% of the clear channel reading, or when the (F7+F8)/(F1+F2) ratio falls below 0.20. Under Bangkok hot season conditions at 16 hours per day, this threshold is typically reached around month 4 of operation. Do not wait for visible brightness decline -- the lux reading will still appear acceptable when F8 has already crossed the plant-affecting threshold. In our data, cotyledon color scores declined measurably 6 to 8 weeks after F8 crossed below 15% of clear, meaning the tray signal lags the sensor signal. (Plant Mood sensor log data, 2024)
Does a lux meter detect LED spectrum degradation?
No. A lux meter measures total photon output weighted by human eye sensitivity, which peaks in the green-yellow range where phosphor degradation is slower. In our 6-month test, lux dropped 11% while F8 at 680 nm dropped 31%. A grower monitoring only lux would see acceptable readings through month 4 while the plant-relevant red output had already degraded significantly. The AS7341 F8 channel or the (F7+F8)/(F1+F2) ratio are the metrics that detect spectral degradation that lux monitoring misses. (Plant Mood sensor log data, 2024)
Does Bangkok heat affect LED grow strip lifespan?
Yes, significantly. Strip surface temperature averaged 46 degrees Celsius during hot season operation in our grow space versus 35 degrees in cool season. The monthly F8 decline rate was 1.8 percentage points of clear per month during cool season and 2.9 percentage points per month during hot season -- hot season degraded red output 60% faster per month. A strip that reaches the replacement threshold in 6 months under cool season conditions may reach equivalent degradation in approximately 4 months if most of its operating life falls in hot season. (Plant Mood sensor log data, 2024)
Why does red LED output degrade faster than blue in white LED strips?
White phosphor LED strips use a blue LED chip to excite a yellow phosphor coating. The blue chip and the phosphor degrade through different mechanisms at different rates. The phosphor is susceptible to thermal quenching and photooxidation, both of which accelerate at higher temperatures. The red output comes from the long-wavelength tail of the phosphor emission, which degrades faster than the peak because it is produced by higher-energy interactions in the phosphor crystal that are preferentially disrupted by heat. The blue chip output (F2 channel) remained at 94% of week-1 value at month 6 while F8 was at 56% -- the blue chip barely degraded while the phosphor tail collapsed. (Plant Mood sensor log data, 2024)
Is replacing a cheap LED strip with another cheap strip worth it for microgreens?
Yes, when the old strip has degraded past the replacement threshold. A new cheap strip restores the spectral baseline the grow protocols were calibrated against. In our data, the cycle immediately after replacing a 6-month-old strip with an identical new unit scored 3.8 on cotyledon color versus a 1.8 average from the final month of the old strip. The improvement was a return to baseline, not an upgrade. A grower running protocols calibrated to a ratio of 0.26 and operating a 6-month strip at 0.17 is working against a source that has drifted outside the parameters those protocols assumed.
How do I monitor LED grow strip spectrum degradation with AS7341?
Log an AS7341 baseline at installation: F1 through F8 channels, clear channel, (F7+F8)/(F1+F2) ratio, F8 as percentage of clear, and strip surface temperature. Use identical gain and integration time settings for all future readings. Take a monthly reading under the same conditions. Check two thresholds: F8 below 15% of clear and ratio below 0.20. Either threshold crossed triggers replacement. Flag hot season readings separately because degradation rate increases with temperature. The baseline reading at installation is the step most growers skip and the one the entire protocol depends on.