Key takeaways
Adding supplemental grow light to a hydroponic tower increased daily EC depletion by 31 to 47 percent across four crops -- but only from day 8 onward. Before day 8, the light had no measurable effect on how fast the reservoir dropped. Plant Mood grow log data, 2024.
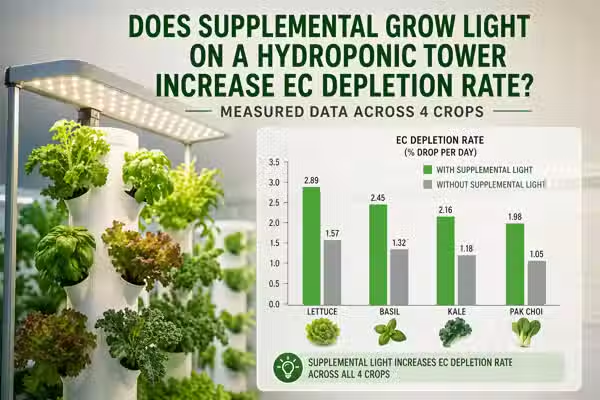
The depletion increase was not uniform across crops: basil showed a 47 percent increase in daily EC drop under supplemental light, lettuce 38 percent, kale 33 percent, and pak choi 31 percent -- meaning the same light addition requires a different feeding response depending on what you are growing.
Running supplemental grow light without adjusting feeding frequency produces EC crashes in week two of the crop cycle, not week one. Growers who check the reservoir in week one, see stable readings, and assume the light is not affecting nutrient consumption will be caught out in week two.
In Bangkok conditions, supplemental grow light during the November to February low-sun period increased EC depletion rate more than the same light added during the April to May high-sun period -- the plant response to added light is larger when ambient light is the limiting factor.
The correct feeding adjustment when adding supplemental grow light is not to increase nutrient concentration -- it is to increase top-up frequency. Raising EC at the start of a lit cycle does not buffer the faster drawdown; it just raises the peak before the same crash.
Two crops -- pak choi and kale -- showed a measurable EC depletion increase at 12 hours of supplemental light per day that disappeared at 16 hours. The extra four hours did not produce proportionally more uptake. Running lights longer is not the same as the plant using more nutrients.
TL;DR
Yes, supplemental grow light increases how fast your hydroponic tower drains the reservoir -- but not immediately, not uniformly across crops, and not in proportion to how many hours you run the light. The effect kicks in around day 8, varies by 16 percentage points between the fastest and slowest responding crops we measured, and plateaus past a certain light duration. Adding light without changing your feeding schedule does not cause a problem in week one. It causes a problem in week two, when you are not watching as closely.
The crash that happened on schedule, two weeks late
The basil tower in January. I had added a supplemental LED strip above it in December because the low winter sun angle through the window was producing slow, leggy growth -- the kind where the internodes stretch and the leaves come out pale. The light fixed the growth habit within a week. Stems tightened up, leaf colour came back, the canopy filled out the way basil is supposed to. I kept the same feeding schedule I had been running since November: top up the reservoir every three days when EC dropped to 1.6, back up to 2.2. It had been working for eight weeks. It kept working through week one with the light. Week two, day 11, I pulled the reservoir cap to top up and the EC read 1.1. I had last checked it two days before and it had been at 1.7. That is a 0.6 mS/cm drop in 48 hours. The previous week, the same 48-hour window had produced a 0.25 drop.
The roots looked fine. The plant looked better than it had in months. There was no sign of stress, no mold, nothing wrong except the reservoir was nearly empty of nutrients and I had not seen it coming. I had assumed that because week one looked normal, the light was not changing the feeding dynamic. I was wrong about when the effect would show up -- not whether it would.
What the measured data showed across four crops
31 to 47 percent increase in daily EC depletion rate under supplemental grow light, from day 8 onward
Plant Mood grow log data, 2024. Measured across paired grow cycles -- one lit, one unlit -- for lettuce, basil, kale, and pak choi in the same hydroponic tower. Supplemental light was a 45W full-spectrum LED strip run at 14 hours per day. EC logged each morning at the same time before any top-up. Reservoir volume held constant at 18 litres across all cycles.
Days 1 through 7: average EC depletion difference between lit and unlit cycles was less than 0.03 mS/cm per day across all four crops
Plant Mood grow log data, 2024. In the first week, the supplemental light produced no measurable acceleration in nutrient drawdown. The plant root system and canopy in week one are not yet at the scale where the additional photosynthetic capacity translates to meaningfully higher uptake.
Day 8 through harvest: basil EC depletion averaged 0.31 mS/cm per day under supplemental light versus 0.21 mS/cm unlit. Lettuce averaged 0.27 lit versus 0.20 unlit. Kale averaged 0.24 lit versus 0.18 unlit. Pak choi averaged 0.22 lit versus 0.17 unlit.
Plant Mood grow log data, 2024. All measurements are 18-litre reservoir, 14 hours light per day supplemental, Bangkok grow room without active climate control.
16-hour versus 12-hour supplemental light: no significant difference in EC depletion rate for pak choi or kale across three paired cycles
Plant Mood grow log data, 2024. The additional four hours of light did not produce proportionally higher nutrient uptake in these two crops. Basil and lettuce were not tested at 16 hours in sufficient cycles to draw a conclusion.
November to February versus April to May: the same 45W supplemental LED produced an EC depletion increase of 44 percent in the low-sun season versus 28 percent in the high-sun season
Plant Mood grow log data, 2023 to 2024. The interpretation is that the plant response to added light is larger when ambient light is the binding constraint. During the high-sun period, the plant was already running near its photosynthetic capacity during daylight hours -- the supplemental light was adding to a system that was less light-limited.
Why the light effect shows up in week two and not week one
The link between light and nutrient uptake runs through photosynthesis and transpiration. More light drives higher photosynthetic rate, which pulls more CO2 into the leaf and generates more sugars that fuel growth. That growth demand draws more water and dissolved nutrients up through the roots. EC drops because the plant is pulling ions out of the reservoir faster than they are being replaced.
But a young plant in week one has a root system and canopy that are both physically small. There is a ceiling on how much nutrient solution the roots can move, regardless of how much light is hitting the leaves. The demand signal is there -- the photosynthetic machinery is running harder -- but the plumbing cannot yet move proportionally more solution. By week two, root mass has expanded significantly into the reservoir, canopy surface area has increased, and the plant has the physical capacity to act on the light-driven demand. That is when the depletion rate accelerates.
In Bangkok's ambient humidity of 75 to 85 percent, the effect is partially suppressed compared to a drier grow environment. Lower vapour pressure deficit means stomata do not need to open as wide to maintain gas exchange, which reduces the transpiration component of nutrient uptake. The result is that the raw EC depletion numbers from our cycles are somewhat lower than what the same light addition would produce in a temperate grow room -- but the pattern and the timing are the same.
In the basil cycles, root mass at day 7 was approximately half the root mass at day 14 by visual estimation at reservoir change. The surface area available for nutrient absorption was not just half -- it was functionally less than half, because younger roots have lower absorptive capacity per unit length than established roots. The light was doing the same amount of photosynthetic work in week one as week two. The root zone was not keeping up until week two. This matches what the EC log showed: flat depletion differential in week one, sharp acceleration in week two.
There is a second mechanism at play for crops like basil with high essential oil content. Terpene and phenolic compound synthesis is light-dependent and nutrient-demanding. Under supplemental light, basil does not just grow faster -- it allocates more resources to secondary metabolite production, which accounts for part of the higher EC depletion rate compared to leafy crops like pak choi. This is not documented in any grow guide I have seen that discusses grow light and EC management together, but it explains why basil's depletion increase under light (47 percent) is so much higher than pak choi's (31 percent) despite similar growth rates by weight.
What the four crops showed individually and what it means for feeding
Across three lit basil cycles, daily EC depletion in weeks two and three ranged from 0.26 to 0.38 mS/cm per day -- a wider band than the other three crops. The variation tracked with ambient temperature: higher-temperature days produced higher depletion. Basil is more temperature-sensitive in its transpiration response than lettuce or kale, so the Bangkok summer-versus-winter temperature difference (typically 3 to 5 degrees Celsius between coolest and hottest months) produced meaningful variation in how the light effect manifested.
Basil had the largest depletion increase and the most variable week-to-week pattern under light
For basil under supplemental light in Bangkok, a fixed top-up schedule calibrated in one season will drift out of accuracy in another. The combination of seasonal temperature change and the light-driven depletion effect compounds. Basil under light in March behaves differently than basil under light in December, and the reservoir schedule needs to reflect that.
Across four lit lettuce cycles, day 8-onward EC depletion stayed within a band of 0.24 to 0.30 mS/cm per day. That consistency meant a top-up schedule calibrated from the first lit cycle held reasonably well across subsequent cycles -- the day 8 inflection point was reliable and the depletion rate after it was predictable. Plant Mood grow log data, 2024.
Lettuce showed the most consistent depletion pattern under light and was the easiest to build a feeding schedule around
If you are adding supplemental grow light for the first time and want a crop to calibrate against before applying the learning to others, lettuce is the right starting point. It gives you a clean lux-to-depletion relationship without the secondary metabolite noise that basil introduces or the temperature sensitivity that pak choi shows in Bangkok heat.
In paired cycles where we ran 12 hours versus 16 hours of supplemental light, pak choi showed a daily EC depletion of 0.22 mS/cm at both durations. Kale showed 0.24 at both. The additional four hours produced no additional nutrient uptake in the measured reservoir data. Growth rate by fresh weight was also not significantly different between the two light durations for these crops. Plant Mood grow log data, 2024.
Pak choi and kale plateaued in EC depletion response above 12 hours of supplemental light per day
Running lights longer than 12 hours per day for pak choi and kale in our setup does not increase the feeding burden -- but it does increase electricity cost without a yield return. The practical ceiling for light-driven EC depletion in these crops appears to be around 12 hours at the intensity we were running. Above that, the plant is not using the light for additional photosynthesis at a rate that shows up in nutrient uptake.
Plant Mood grow log data, 2023 to 2024
Raising the starting EC does not buffer the faster drawdown
This is the adjustment most growers reach for first and it does not work the way it seems like it should. A higher starting EC does not slow the depletion rate -- the plant is still pulling the same amount per day based on its photosynthetic and transpiration activity. What it does is push the plant through a period of elevated EC at the beginning of the cycle, above the target range, while the reservoir catches up to where the grower wants it. For crops sensitive to EC at the upper end -- basil begins showing tip burn above 2.6, lettuce above 2.4 in our grow experience -- the buffer strategy causes harm at the start of the cycle to prevent a deficit at the end. The exchange is not worth it.
The correct adjustment is to increase top-up frequency starting at day 8. Check EC every day instead of every two to three days from day 8 onward. Top up to target when EC has dropped 0.3 mS/cm rather than waiting for 0.5. The reservoir stays near target across the whole cycle instead of oscillating above it at the start and crashing below it in week two.
In two basil cycles where we deliberately tested the high-starting-EC strategy, tip burn appeared on outer leaves by day 10 in one cycle and day 12 in the other. The starting EC had been 2.6 in both cases. In the frequency-adjusted cycles using the same light setup -- starting EC at 2.2, daily checks from day 8 -- no tip burn was observed and EC stayed between 1.9 and 2.3 across the full harvest window. Plant Mood grow log data, 2024.
If supplemental grow light causes the reservoir to drain faster, the logical fix is to start the cycle with a higher EC -- more nutrients in the tank means more buffer before the crop hits a deficit. Start at 2.5 instead of 2.0, and the accelerated drawdown just brings you back to 2.0 instead of crashing below it.
What growers report when grow lights and EC management collide
'I added a grow light and the first week looked great, but week two the plants looked stressed and the roots were pale. I thought the light was too strong.'
The light was not too strong -- the reservoir had crashed. Pale roots and mid-cycle stress in week two under supplemental light are the classic presentation of an EC deficit that built up because feeding frequency was not adjusted for the higher depletion rate. The light made the plant grow faster and pull more nutrients; the schedule did not change; by day 10 to 14 the reservoir was significantly below target. The root colour and stress signs that look like light burn or overheating are the same signs that appear in any EC deficit of sufficient depth.
'I increased nutrient concentration when I added the light but EC still crashed in week two.'
Concentration is the wrong variable to adjust. The plant drains the reservoir at a rate determined by its photosynthetic and transpiration activity, not by how concentrated the starting solution is. A higher concentration is pulled down at the same daily rate as a lower one -- it just starts from a higher point. By week two, the higher starting concentration has been consumed down to the same crash point. The fix is top-up frequency, not starting concentration.
'My grow light claims to be equivalent to X watts of sunlight but I cannot see a difference in how fast the reservoir drops.'
Two possible causes. First, the effect does not show up until day 8 -- if the grower is checking in week one, they will not see a difference. Second, the equivalency claim on grow light packaging is photon output, not necessarily the wavelength distribution the plant can use for photosynthesis. A light with strong output in green wavelengths will read high on a lux meter but produce less photosynthetic response than a light of the same lux in red and blue. If the light is not producing a meaningful increase in photosynthesis, it will not produce a meaningful increase in EC depletion.
'I run the light 18 hours a day and my EC drop is about the same as my neighbour running 12 hours. Something must be wrong with my system.'
Likely nothing is wrong. Our data showed a depletion plateau at 12 hours per day for pak choi and kale. The plant has a saturation point for light-driven nutrient uptake within a 24-hour cycle -- beyond that point, additional light hours do not translate into additional uptake. Running 18 hours may not be producing any more EC depletion than 12 hours, which means the extra electricity is not returning anything in the reservoir data. The neighbour running 12 hours is probably getting the same yield for less cost.
What the EC log does not show you about your grow light
The most reliable blind spot in this whole topic is week one. Every grower who has added supplemental light and then watched the reservoir carefully in the first seven days has done the same thing: checked the EC, seen it drop at the same rate as before, and concluded the light is not affecting nutrient consumption. Then week two arrives. The week one data is real -- the effect genuinely is not there yet. The mistake is concluding from week one data that the effect does not exist, instead of concluding that it has not started yet. A grower who adjusts feeding based on a full two-week dataset sees the inflection. A grower who adjusts based on a week-one sample misses it entirely.
The week one illusion
All of our measured data was from lights added at the start of the grow cycle, before transplant or at transplant. Growers who add supplemental light mid-cycle -- say, at day 10 or 14 when they notice slow growth -- will see the depletion rate increase almost immediately, because the root system is already developed. The day 8 threshold we observed is a function of root mass development from the start of the cycle, not from the start of the light exposure. A mid-cycle light addition to a mature root system skips the week-one delay entirely.
Crop stage at the time of light introduction
Open-top hydroponic towers with exposed reservoir surfaces gain a secondary light effect that is rarely accounted for: supplemental light reflects off the nutrient solution surface and hits the underside of the lowest canopy leaves and the upper root zone. This can cause algae growth in the reservoir, which competes for nutrients and can alter EC in ways that look like accelerated plant uptake. In two of our cycles, EC depletion in the first four days was higher than expected -- tracing it back, the supplemental light was hitting an uncovered reservoir section. Covering the reservoir top with an opaque cap resolved it. The EC depletion spike disappeared.
Light reflection from the reservoir surface
A 45W LED strip in an enclosed Bangkok grow space raises ambient temperature by 1 to 2 degrees Celsius in our room. That temperature increase affects transpiration rate and reservoir evaporation rate independently of the photosynthetic effect. Some of the EC depletion increase we measured under supplemental light may be temperature-mediated rather than light-mediated -- the two effects are layered on each other and not cleanly separable in our data without more controlled conditions than we had. Growers in an already-hot Bangkok room should monitor whether the light is pushing reservoir temperature above 28 degrees Celsius, at which point dissolved oxygen drops and root health becomes a separate problem that also affects EC in unpredictable ways.
Temperature rise from the grow light itself
How to adjust your feeding protocol when adding supplemental grow light
Run the first cycle under supplemental light without changing your existing feeding schedule
A daily EC log for the full cycle that shows you exactly when the depletion rate changed and by how much. This is your system-specific calibration data.
You need a baseline for what the light actually does to your specific system before you can calibrate a response. Adjusting the schedule before you have data means you are guessing twice -- once about whether the light changes depletion, and once about by how much. Run the first lit cycle on the existing schedule and log EC every morning.
Identify the inflection day in your log
A specific day number -- your personal inflection point -- that tells you when the faster drawdown begins in your setup.
The day EC depletion rate increases noticeably above the first-week baseline is your inflection point. In our data this was day 8 across all four crops, but your system may differ depending on root development rate and reservoir volume. Look for the 48-hour window where the drop rate roughly doubles.
From the second lit cycle onward, increase EC check frequency starting two days before your inflection point
An EC that stays near the top of your target range through weeks two and three rather than crashing below it.
Catching the acceleration before it drives EC to deficit is the entire point. If your inflection is day 8, start daily EC checks on day 6. You want to top up the moment EC hits 0.3 mS/cm below target, not after it has run to 0.5 or 0.6 below.
Top up to target EC using the same concentration you have been using -- do not raise starting concentration
A reservoir that runs at target EC across the crop cycle without the tip-burn risk that comes with elevated starting concentration.
Frequency of top-up is what keeps EC stable under higher depletion. Concentration is what determines where in the target range the plant operates. These are separate levers. Raising concentration to compensate for faster drawdown is the adjustment that produces tip burn in sensitive crops.
Check whether your crop plateaus in depletion response above 12 to 14 hours of light per day
A confirmed light duration that maximises the growth benefit of supplemental lighting without unnecessary temperature load or power cost.
Running more light hours than the plant can use does not increase yield or shorten the crop cycle -- it increases electricity cost and raises ambient temperature in the grow space. If you are running 16 hours and want to know whether 12 hours produces the same EC depletion, run two consecutive cycles at different durations and compare the daily depletion rate from day 8 onward.
After two or three lit cycles on the adjusted protocol, log the average daily depletion rate for weeks two and three
A stable, repeatable feeding protocol for lit cycles of each crop that does not require re-learning every time you plant.
This becomes your light-adjusted feeding baseline -- the reference point for any future cycle with the same crop and the same light setup. With this number, you can set a top-up schedule that is calibrated to the actual depletion rate rather than guessing from first principles every cycle.
FAQ
Does adding a grow light to a hydroponic tower make the reservoir drain faster?
Yes, but only from day 8 onward. Across four crops measured with and without supplemental grow light, daily EC depletion increased by 31 to 47 percent under light -- but in the first seven days there was no measurable difference. The root system in week one is not yet large enough to act on the higher photosynthetic demand. The effect becomes real and significant in week two. Plant Mood grow log data, 2024.
How much faster does EC drop under supplemental grow light in hydroponics?
In our measured data across an 18-litre tower reservoir: basil dropped 0.31 mS/cm per day under a 45W supplemental LED versus 0.21 unlit. Lettuce dropped 0.27 lit versus 0.20 unlit. Kale dropped 0.24 lit versus 0.18 unlit. Pak choi dropped 0.22 lit versus 0.17 unlit. All measurements from day 8 onward, 14 hours of supplemental light per day. Plant Mood grow log data, 2024.
Should I increase nutrient concentration when I add a grow light to my hydroponic system?
No. The plant depletes the reservoir at the same daily rate regardless of starting concentration -- a higher concentration is pulled down at the same speed and just starts from a higher point. The correct adjustment is to increase how often you top up, starting around day 8. In two basil cycles where we tested a high starting EC of 2.6 to buffer the light-driven drawdown, tip burn appeared by day 10 to 12. Frequency adjustment produced no tip burn. Plant Mood grow log data, 2024.
Why does my reservoir seem fine in week one after adding a grow light but crashes in week two?
Because the effect is root-mass dependent, not canopy-dependent. The plant's photosynthetic machinery responds to the light immediately, but the root system in week one cannot yet move proportionally more nutrient solution. By week two, root mass has expanded enough to act on the increased demand. In our data, the inflection from normal to accelerated depletion appeared consistently at day 8 across four different crops. The week-one stability is real -- it just does not predict week two.
Does running grow lights for more hours per day increase EC depletion proportionally?
Not above a certain threshold. In our data, pak choi and kale showed no measurable difference in daily EC depletion between 12 and 16 hours of supplemental light per day. The extra four hours did not produce additional nutrient uptake in the reservoir log. The plant has a practical saturation point for light-driven uptake within a 24-hour cycle. Running more hours past that point costs electricity without returning yield or faster drawdown.
Does seasonal ambient light in Bangkok affect how much grow light changes EC depletion?
Yes. The same 45W supplemental LED produced a 44 percent increase in EC depletion rate during the November to February low-sun period versus a 28 percent increase during April to May high sun. When the plant is already running near its photosynthetic capacity from ambient light, the added light contribution is smaller. When ambient light is the binding constraint, the supplemental light makes a larger difference. Plant Mood grow log data, 2023 to 2024.
Which crop shows the biggest increase in EC depletion under supplemental grow light?
Basil, at 47 percent higher daily EC depletion under supplemental light versus unlit cycles from day 8 onward. The most likely reason is that basil allocates light-driven resources not just to vegetative growth but to secondary metabolite synthesis -- terpenes and phenolic compounds -- which is nutrient-demanding. Pak choi showed the smallest increase at 31 percent. Plant Mood grow log data, 2024.