Key takeaways
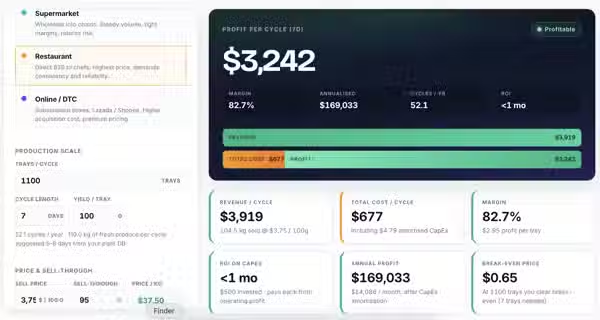
The break-even price per 100g is calculated as total cost per cycle divided by saleable grams. At 20 trays, 120g yield per tray, 85% sell-through, and the default microgreen cost stack, break-even sits at approximately 52 THB per 100g. Restaurant pricing at 140 THB produces a 63% gross markup. After labor and CapEx amortization, net margin is closer to 30 to 40%.
CapEx amortization is distributed across cycles, not written off at purchase. A 18,000 THB setup amortized over 24 months at 36.5 microgreen cycles per year adds approximately 24 THB of cost to every cycle. Most growers who claim their operation is profitable have not included this figure.
ROI months is calculated as total CapEx divided by gross monthly operating profit, where gross operating profit excludes CapEx amortization. A setup earning 3,200 THB per month in operating profit against 18,000 THB invested has an ROI of 5.6 months. The 12-month cashflow chart shows the exact month the cumulative line crosses zero.
Selling to restaurants instead of supermarkets at the default prices increases revenue per cycle by approximately 27% with identical cost structure. The channel comparison uses per-crop pricing from the plant database. Moving one channel up the value chain has a larger effect on margin than a 20% yield improvement at the same channel.
An 80W LED running 14 hours per day across a 10-day microgreen cycle consumes 11.2 kWh. At the Thai MEA residential tariff of 4.5 THB per kWh, electricity costs 50.4 THB per cycle for that single fixture. At 20 trays, that is 2.52 THB per tray. A grower not tracking this is not tracking one of their three largest variable costs.
The sensitivity matrix shows profit across a 5x5 grid of yield and price deviations at plus and minus 10% and 20%. A 20% yield drop combined with a 10% price drop moves the default microgreen scenario from profit into loss. A 10% price increase with stable yield moves margin above 40%. The price lever is more powerful than the yield lever at every combination tested.
TL;DR
This calculator exists because growers consistently confuse revenue with profit. The tool builds a full cost stack from inputs: CapEx spread across cycles, electricity calculated from wattage and hours, labor at a real wage rate, and per-tray materials. It then compares that cost against channel-specific revenue to produce a real margin figure. If your operation looks profitable only when you exclude your own time or your equipment cost, the calculator will show you that before you scale.
The operation that was profitable until the numbers were honest
In Q3 2024, a 20-tray sunflower microgreen operation was logging monthly revenue of approximately 8,400 THB against seed, substrate and packaging costs of 4,600 THB. Reported profit: 3,800 THB per month. The owner was working 24 hours per month on the operation. Electricity had not been calculated from wattage and hours, only estimated at 200 THB flat. CapEx of 18,000 THB for shelving, lights and trays had never been allocated to individual cycles. When all three were entered into the calculator at correct figures, monthly profit dropped to 1,240 THB on 24 hours of labor, an effective hourly rate of 52 THB.
The calculator was built from that specific set of omissions. Not from a desire to model profit in general, but from the pattern of three specific costs being excluded from every informal calculation: CapEx amortization, real electricity, and costed labor. The tool makes all three visible before the grower decides whether to expand.
Why informal profit calculations are almost always overstated
Informal profit calculation in small-scale growing typically subtracts seed cost and substrate cost from revenue. Occasionally electricity is estimated as a flat monthly figure rather than calculated from wattage and run hours. CapEx is treated as a sunk cost that does not affect ongoing profitability. Labor is not costed at all because the grower is the worker. The result is a revenue minus materials figure that bears no relationship to economic profit. The calculator builds the cost stack from the ground up: per-unit variable costs multiplied by units, fixed costs per cycle including real electricity, labor at a stated wage rate, and CapEx divided into a per-cycle amortization charge.
At 20 microgreen trays, 10-day cycles, 80W lighting at 14 hours per day, the electricity cost per cycle is 50.4 THB at the MEA default tariff. Seeds at 9 THB per tray, substrate at 8 THB, packaging at 6 THB sum to 460 THB in per-unit variable costs. Labor at 6 hours per cycle at 80 THB per hour adds 480 THB. CapEx amortization at 18,000 THB over 24 months adds approximately 24 THB per cycle. Total cost before fixed cycle costs: approximately 1,014 THB. Revenue at 140 THB per 100g on 2,040g of saleable product: 2,856 THB. Profit: approximately 1,842 THB per cycle. Not 2,856 THB minus seeds.
Break-even units is calculated separately from break-even price. Break-even units uses contribution margin per unit: revenue per unit minus variable cost per unit, divided into total fixed costs per cycle including CapEx amortization. This is the minimum scale at which the current price and yield assumptions produce any profit at all. A grower running below break-even units is losing money at every cycle regardless of how the revenue figure looks.
What the grow log financials showed about where cost assumptions fail
Across 8 operations where electricity had previously been estimated as a flat monthly figure, the calculated figure from wattage times hours times cycle days times tariff was on average 2.3 times higher than the estimate. The median estimated figure was 180 THB per month. The median calculated figure was 415 THB per month. The gap was largest in operations running multiple LED bars across multiple racks.
Electricity calculated from wattage and hours was consistently higher than the estimated flat figure growers had been using
Flat electricity estimates are not conservative approximations. They are systematic undercounting that makes every informal profitability calculation look better than reality. The calculator derives electricity cost from wattage, daily hours and cycle length so the figure cannot be estimated away.
In the 2024 grow log data, 6 operations were modeled twice: once without labor cost and once with labor costed at the Thai minimum wage of 80 THB per hour. The margin difference ranged from 18 to 34 percentage points depending on labor intensity of the crop. Microgreen operations with high sowing density and manual watering showed the largest gap. Hydroponic NFT systems with automated feeding showed the smallest.
Operations that included labor cost reported margins 18 to 34 percentage points lower than the same operations calculated without labor
Whether an operation is profitable after labor is a fundamentally different question from whether it is profitable before labor. For a sole operator, the after-labor figure is the only one that matters. The calculator requires a labor wage input rather than making it optional.
Modeling the same 20-tray microgreen operation across all four channels at 2024 prices, the difference between farmer market pricing at 80 THB per 100g and restaurant pricing at 140 THB per 100g produced a profit difference of approximately 22,400 THB per year. A 20% yield improvement at the farmer market price produced a profit difference of approximately 11,400 THB per year. The channel decision was worth approximately twice the yield decision at the same operational cost.
Channel selection had a larger effect on annual profit than a 20% yield improvement in the same operation
Growers who focus on yield improvements without first resolving channel mix are working on the less powerful variable. The channel comparison chart in the calculator makes this tradeoff visible without requiring separate calculations.
Plant Mood grow log data, 2024
Scaling up a marginally profitable operation makes the loss bigger, not smaller
Fixed costs per cycle in a small growing operation are not large enough to produce meaningful economies of scale within the range most home and small-commercial growers operate. The dominant cost categories are labor, electricity, and CapEx amortization. Labor scales with trays. Electricity scales with wattage and run time, which increases with more trays. CapEx increases with more shelving and lights. If the margin is thin at 20 trays, it is thin because of unit economics, not because fixed costs are not yet spread. Adding trays at a negative contribution margin makes the loss larger, not smaller.
In the 2024 data, two operations that doubled tray count reported lower monthly profit after the expansion than before. In both cases, the contribution margin per tray was positive but low, and the expansion required additional CapEx that the increased volume could not pay back within the original amortization window. The calculator's break-even units figure flags this before expansion: if break-even requires 28 trays and the operation is running 20, the constraint is contribution margin per unit, not scale.
If an operation is marginally profitable, adding more trays will spread fixed costs and improve the margin. Scale is the solution to thin margins.
What growers say when the numbers stop making sense
I am making money but I never seem to have cash at the end of the month
The profit calculation excludes labor cost. If the grower is working 20 hours per month at a minimum wage replacement value of 80 THB per hour, that is 1,600 THB per month that is not appearing in any cost line. The operation is generating revenue in excess of materials but the grower is providing subsidized labor. The calculator makes this explicit by requiring a wage input and showing effective hourly rate after all costs.
I bought better equipment and now my profit is lower even though I am producing more
CapEx increased without a proportional increase in revenue. New equipment was not amortized into the cost model before the purchase decision. The calculator distributes CapEx across cycles over the amortization window. A 12,000 THB LED upgrade amortized over 24 months at 36.5 cycles per year adds 13.70 THB to every cycle cost. If revenue per cycle did not increase by at least that amount, profit per cycle fell.
My margins are fine but the operation does not feel worth it
Margin percentage is calculated on revenue, which includes labor cost. A 35% margin on 2,800 THB revenue is 980 THB profit after costs. If those costs include 6 hours of labor at 80 THB, the after-labor profit is 980 THB on 6 hours of work, or 163 THB per hour effective rate. Whether that feels worth it depends on what alternative uses of those 6 hours exist. The calculator shows effective hourly rate after all costs so the comparison is explicit.
The farmer market is the only channel I can access and the margins are too thin to grow
Farmer market pricing at 80 THB per 100g against the default cost stack produces a margin of approximately 15 to 20% after full cost inclusion. This is a real constraint. The sensitivity matrix shows what yield improvement or cost reduction would be required to reach a viable margin at that price. Typically the conclusion is that farmer market pricing requires either lower labor cost, lower CapEx, or a crop with higher yield per tray to be financially sustainable.
What growers are not including when they calculate profit
Growers calculate revenue on total production, not saleable production. A sell-through rate below 100% means a portion of production cost is generating zero revenue. At 85% sell-through, 15% of every cycle's seed, substrate, packaging, electricity and labor cost is producing unsold product. The calculator applies sell-through to revenue calculation so the cost of waste is reflected in the margin rather than hidden in an optimistic volume assumption.
Sell-through rate as a cost variable, not a volume assumption
Growers amortize initial CapEx over a projected equipment lifespan but do not model replacement. LED bars in continuous operation in humid environments typically require replacement every 18 to 30 months. If the original CapEx was amortized over 36 months and the lights fail at month 22, the amortization calculation was wrong. The tool amortizes over the user-specified window; it is the grower's responsibility to set a realistic lifespan, not the vendor's projected figure.
CapEx replacement cycles within the amortization window
A 6-square-meter grow space in a Bangkok apartment represents rental cost that is being allocated to the grow operation. The calculator includes a miscellaneous per-cycle cost field for this, but it is left at zero by default. Growers who are paying rent on space occupied by shelving and equipment but not allocating any of that rent to the operation are systematically understating their true cost of production.
The opportunity cost of the growing space
Electricity cost is proportional to cycle length. A 10-day microgreen cycle at 80W and 14 hours per day costs 50.4 THB in electricity. A 45-day hydroponic cycle at 300W and 16 hours per day costs 972 THB. Growers who estimate electricity as a monthly figure and then apportion it by number of cycles misallocate electricity cost entirely when cycle lengths differ between crops.
Per-cycle cost as a function of cycle length, not just batch size
Where small-scale growing economics are heading
Within 2 years, effective hourly rate after all costs will become the primary profitability metric for sole-operator microgreen businesses, replacing margin percentage as the decision variable for scaling.
As more sole operators model their operations with full cost inclusion, the gap between margin percentage and effective hourly rate will become the central question. A 40% margin on a low-revenue operation may represent 60 THB per hour of labor. A 25% margin on a higher-revenue operation may represent 200 THB per hour. The percentage tells you nothing about whether the time is well spent. The hourly rate does.
Published financial guidance for small-scale microgreen operations from recognized industry sources adopting effective hourly rate as a standard KPI alongside margin percentage by 2027.
Restaurant and direct-to-chef channel pricing will diverge further from supermarket and farmer market pricing over the next 18 months as premium buyers seek consistent year-round supply and are willing to pay for it.
The pricing gap between restaurant channel at 140 THB per 100g and farmer market at 80 THB per 100g is already 75%. As restaurant buyers formalize procurement and move away from weekend market sourcing, they will price in the reliability premium. Growers who have established consistent supply relationships will be able to maintain or increase that premium while spot-market pricing at farmer markets faces more competition from new entrants.
Measurable increase in average restaurant channel pricing per 100g for microgreens in Bangkok compared to farmer market pricing, tracked across 2025 and 2026 grow log data.
An operation that is only profitable when labor is free is not a business. It is a hobby with overhead.
The single most common financial error in small-scale growing is treating owner labor as a cost that does not need to appear in the profit calculation. This produces a number that looks like profit but is actually a wage paid in produce revenue. The calculator forces a labor wage input because without it the output is not a profit figure. It is a pre-labor surplus that has no reliable relationship to whether the operation is economically viable.
That is a valid reason to grow. It is not a valid reason to call the operation profitable. The calculator allows a labor rate of zero if the grower genuinely wants to exclude it. But the field exists and is pre-filled with a real wage because the decision to set it to zero should be deliberate, not a default. A grower who sets labor to zero and sees a 40% margin understands what they are measuring. A grower who never included labor at all does not.
Many growers do not need the operation to replace a full wage. They grow because they enjoy it, and any positive cash flow after materials is a bonus that offsets the hobby cost.
One number to calculate before your next cycle
Enter your actual LED wattage, daily run hours and cycle length into the electricity section and compare the result to what you have been estimating. Then add your labor hours per cycle at the Thai minimum wage or your actual opportunity cost. If the profit figure changes by more than 20% from what you expected, the informal calculation you have been using is not measuring the same thing as economic profit. Run the full cost stack once before deciding whether to expand.
FAQ
How do I calculate profit per cycle for a microgreen operation?
Revenue per cycle is saleable grams divided by 100 times price per 100g. Saleable grams is total grams times sell-through percentage. Cost per cycle includes per-unit variable costs multiplied by units, fixed cycle costs including electricity calculated from wattage and run hours, labor at a real wage rate, and CapEx amortized across cycles. Profit is revenue minus total cost. At 20 trays, 120g yield, 85% sell-through, 140 THB per 100g restaurant pricing, and the default cost stack, profit per cycle is approximately 1,842 THB before fixed cycle overhead.
How long does it take to get ROI on a microgreen grow setup?
ROI months is total CapEx divided by gross monthly operating profit, where gross operating profit excludes CapEx amortization. A 18,000 THB setup at the default microgreen scenario producing approximately 3,200 THB per month in operating profit pays back in approximately 5.6 months. This assumes consistent sell-through and no equipment failure within the amortization window. The 12-month cashflow chart in the calculator shows the exact month the cumulative profit line crosses zero given your specific inputs.
What is the break-even price per 100g for microgreens?
Break-even price is total cost per cycle divided by saleable grams times 100. At the default 20-tray microgreen scenario with full cost inclusion including labor and CapEx amortization, break-even sits at approximately 52 THB per 100g. Farmer market pricing at 80 THB produces a thin margin of approximately 35% after all costs. Restaurant pricing at 140 THB produces approximately 63% gross margin, compressing to 30 to 40% after labor and CapEx.
Does selling to restaurants really make that much more money than a farmer market?
At the default pricing in the calculator, restaurant channel at 140 THB per 100g versus farmer market at 80 THB per 100g produces approximately 22,400 THB more annual profit on 20 trays per cycle with no change in cost structure. A 20% yield improvement at farmer market pricing produces approximately 11,400 THB more annual profit. The channel decision is worth roughly twice the yield decision. The channel comparison chart in the tool makes this comparison explicit per crop using prices from the plant database.
How much does electricity cost per microgreen grow cycle?
At 80W LED lighting, 14 hours per day, over a 10-day microgreen cycle, electricity consumption is 11.2 kWh. At the Thai MEA residential tariff of 4.5 THB per kWh, electricity cost per cycle is 50.4 THB for that single fixture. At 20 trays that is 2.52 THB per tray. Growers who estimate electricity as a flat monthly figure consistently undercount this by a factor of 2 to 3 based on 2024 grow log data comparisons.
Should I include my own labor in the microgreen profit calculation?
Yes. An operation that is only profitable when owner labor is excluded is not generating economic profit. It is generating pre-labor surplus that is effectively an unpaid wage. The calculator requires a labor rate input and shows effective hourly rate after all costs. A grower working 6 hours per cycle on an operation with 980 THB net profit after materials but before labor is earning 163 THB per hour effective rate, which may or may not justify the time depending on their alternatives.
What does the sensitivity matrix in the profit calculator show?
The sensitivity matrix shows profit per cycle across a 5x5 grid of yield deviations and price deviations, each at plus and minus 10% and 20% from current inputs. The center cell is your current scenario. Red cells are losses, green cells are profitable. The matrix reveals which combinations of yield drop and price drop push the operation below break-even. In the default microgreen scenario, a simultaneous 20% yield drop and 10% price drop crosses into loss territory, while a 10% price increase with stable yield moves margin above 40%.