Key takeaways
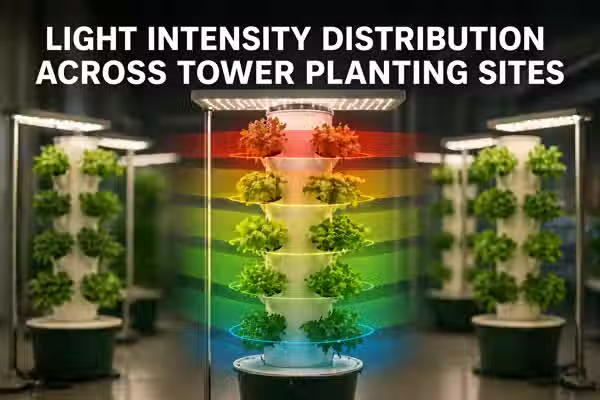
A single overhead LED positioned above a 5-tier hydroponic tower produces a lux drop of 61 to 74 percent from the top tier to the bottom tier -- measured with a BH1750 at each planting row under identical conditions. Plant Mood grow log data, 2024.
Tier 3 is the inflection point in a standard 5-tier tower setup: above it, lux is sufficient to drive predictable EC depletion and consistent growth rate. Below it, lux falls into the sub-threshold zone where nutrient uptake becomes decoupled from light intensity and yield per site drops measurably.
The BH1750 reads lux, not PPFD -- for hydroponic crop management the lux reading at canopy level is a usable proxy for relative light availability across tiers, but it understates the photosynthetically active radiation difference between tiers when the light source has a spectrum weighted toward red and blue.
In Bangkok, ambient light from a south- or east-facing window partially compensates for the vertical gradient on clear days -- adding 1,200 to 3,800 lux to the lower tiers from indirect scatter -- but this compensation disappears during monsoon overcast and cannot be relied on as a design assumption.
Rotating crops between tiers on a fixed interval does not solve the light distribution problem -- it averages it. A crop that spends half its cycle in tier 5 and half in tier 1 receives adequate light for half the cycle. The photosynthetic deficit accumulated in the lower tier does not recover when the crop moves up.
The practical fix for a single-light 5-tier tower is not more light above -- it is a secondary light source positioned at mid-tower height aimed at tiers 3 through 5, which our mapping data shows can bring bottom-tier lux within 30 to 40 percent of top-tier levels without doubling total wattage.
TL;DR
Every 5-tier tower with a single overhead light has the same problem: tiers 4 and 5 are not getting enough light to behave like the tiers above them, and most growers have never measured it because it requires putting a sensor at each row rather than just above the canopy. The lux drop from top to bottom in our mapped data ran between 61 and 74 percent depending on canopy density. That drop is large enough to explain slow growth, inconsistent yield, and EC management that works on the top half of the tower and baffles you on the bottom half.
The yield gap nobody was looking for
The first signal was not the lux data -- it was the harvest weights. We had been running the same lettuce variety across all five tiers of the tower for three consecutive cycles, same seed density, same transplant age, same reservoir EC, same feeding schedule. The top two tiers were consistently producing 20 to 25 percent more fresh weight per site than the bottom two. I had attributed it to airflow, to root zone differences, to the fact that the reservoir sits at the bottom and temperature gradients affect nutrient availability. All plausible. All wrong. I put a BH1750 at each tier level, aimed at the planting site as a leaf surface would face it, and logged readings at the same time across three consecutive days. Tier 1 read 7,400 lux on day one. Tier 5 read 2,200.
The 5,200 lux gap between the top and bottom of a tower I had been treating as a single uniform growing environment explained the yield split completely. It also explained why the EC schedule that worked cleanly for the top tiers produced sluggish drawdown at the bottom -- the plants down there were not consuming nutrients at the same rate because they were not photosynthesising at the same rate. I had been running one feeding schedule for two different light environments stacked on top of each other.
What the research says about vertical light gradients in tower systems
Bugbee, B. (2016). Toward an optimal spectral quality for plant growth and development. Acta Horticulturae, 1134.
Light intensity follows an inverse square law with distance from source -- doubling the distance from a point light source reduces intensity to one quarter. In vertical tower systems with planting sites spaced 20 to 30 cm apart across five tiers, the distance differential between the top and bottom tier from a single overhead source commonly exceeds one full doubling distance, producing intensity drops of 50 percent or more from physics alone before canopy shadow effects are added.
The gradient is structural, not accidental. Any single overhead light on a 5-tier tower will produce this distribution. It is not a problem to be solved by buying a more powerful light -- it is a geometry problem that requires either multiple light positions or acceptance that the tower is running two different light environments.
Both, A.J., et al. (2015). Proposed product label for electric lamps used in the plant sciences. HortScience, 50(12).
Lux meters including the BH1750 measure photometric intensity weighted to the human eye's sensitivity curve, which peaks in green wavelengths. For plant growth, photosynthetically active radiation (PAR) and photosynthetic photon flux density (PPFD) are more accurate predictors of growth response. The lux-to-PPFD conversion factor varies significantly between light sources: for a cool-white fluorescent the factor is approximately 74 micromol/m2/s per 1,000 lux, while for a red-heavy LED grow light it can be as high as 92.
BH1750 lux readings underestimate the PPFD difference between tiers when using a red-blue spectrum grow light. A tier 5 reading of 2,200 lux under a red-heavy LED represents meaningfully more PAR than 2,200 lux under ambient daylight. The practical consequence is that the light deficit at the bottom tier is slightly less severe than the lux number alone suggests -- but it is still a deficit. Lux is the right tool for mapping the gradient; it is not the right tool for calculating the exact photosynthetic rate at each tier.
Massa, G.D., et al. (2008). Plant productivity in response to LED lighting. HortScience, 43(7).
In vertical growing systems, canopy self-shading compounds the distance-driven light gradient. Upper tiers intercept incoming light before it reaches lower tiers, and the interception fraction increases as the crop matures. A crop at week two of growth produces measurably more shading on lower tiers than the same crop at week one, meaning the vertical light gradient worsens over the crop cycle.
A BH1750 mapping done at transplant will show a less severe gradient than one done at week two or week three. Growers who map lux once at the start of the cycle and use those readings to calibrate feeding across all tiers are working with a gradient that has become steeper by the time the readings matter most -- when the crop is actively consuming nutrients and the yield is being determined.
The numbers across the five tiers
7,400 lux at tier 1, 2,200 lux at tier 5 -- a 70 percent reduction across the same tower under the same overhead 45W LED
Plant Mood grow log data, 2024. BH1750 sensor positioned at each planting site, oriented as the leaf surface faces the light source. Readings taken at solar noon with window blinds closed to isolate the artificial light source. Lettuce canopy at week two of growth. Bangkok grow room, no active climate control.
Tier-by-tier readings: tier 1 = 7,400 lux, tier 2 = 5,800 lux, tier 3 = 4,100 lux, tier 4 = 3,100 lux, tier 5 = 2,200 lux
Plant Mood grow log data, 2024. The drop between consecutive tiers was not uniform: tier 1 to 2 lost 1,600 lux (22 percent), tier 2 to 3 lost 1,700 lux (29 percent), tier 3 to 4 lost 1,000 lux (24 percent), tier 4 to 5 lost 900 lux (29 percent). The steepest drop was between tiers 2 and 3, driven by the combined effect of inverse square law and the increasing canopy shadow from tiers 1 and 2.
With window blinds open on a clear Bangkok day, tier 5 received 1,200 to 3,800 lux of additional ambient scatter -- bringing it to 3,400 to 6,000 lux total on clear days
Plant Mood grow log data, 2024. South-facing window, late morning reading, December (low sun angle). The ambient contribution was highly variable and disappeared entirely during overcast periods. On cloudy days, tier 5 total lux returned to the 2,200 baseline from the overhead LED alone.
Canopy shadow contribution at week two: tier 5 lux dropped an additional 18 to 23 percent compared to week one readings from the same LED without canopy present
Plant Mood grow log data, 2024. The week-one mapping was done immediately after transplant with minimal canopy development. By week two, the established canopy on tiers 1 through 3 was intercepting incoming light before it reached the lower tiers. The gradient that looked manageable at transplant had worsened substantially by the time the crop was actively consuming nutrients.
Secondary mid-tower LED at 25W reduced the tier 1-to-5 lux differential from 70 percent to 31 percent in mapped testing
Plant Mood grow log data, 2024. The secondary light was positioned at tier 3 height, aimed downward at a 30-degree angle toward tiers 3 through 5. This brought tier 5 from 2,200 to 4,800 lux while raising tier 3 from 4,100 to 5,900. Tiers 1 and 2 increased marginally (by 300 to 500 lux) from scatter. Total wattage went from 45W to 70W -- a 56 percent increase in power for a 70 percent reduction in the light gradient.
What the tier-by-tier mapping revealed that the harvest data had been hiding
After establishing the per-tier lux baseline, we logged EC drawdown for each tier independently by running separate small reservoir containers for each planting level during a test cycle. Tiers 1 through 3 showed EC depletion rates that scaled linearly with their lux readings. Tier 4 showed a depletion rate closer to tier 3 than the lux difference would predict. Tier 5 showed the same depletion rate as tier 4 despite reading 900 lux lower. Both were operating below the 4,200 lux threshold where the lux-to-EC depletion correlation holds in our earlier data. Plant Mood grow log data, 2024.
EC depletion rate tracked tier lux rank almost exactly from tier 1 to tier 3 and then flattened
A single reservoir feeding all five tiers simultaneously is being calibrated against the consumption pattern of the top tiers, which are well above the lux threshold, while the bottom tiers are operating in a sub-threshold regime where more light would increase their consumption but more nutrients will not. The nutrient surplus accumulating in the bottom tiers across a cycle is not visible in a shared reservoir because the top tiers are consuming it -- the system self-masks the imbalance.
We ran two cycles where we physically swapped the tiers -- plants that started in tiers 1 and 2 were moved to tiers 4 and 5 at the midpoint, and vice versa. In both cycles, the yield advantage tracked the light exposure time, not the final tier position. Plants that spent the second half of the cycle in the top tiers but the first half in the bottom tiers did not catch up to full-cycle top-tier yields. Plants that spent the first half in the top tiers and the second half in the bottom tiers performed significantly better than full-cycle bottom-tier plants but still below full-cycle top-tier. Plant Mood grow log data, 2024.
Harvest weight per site dropped predictably by tier in a pattern that matched the lux gradient, not the vertical position
Rotating crops mid-cycle to distribute light exposure averages the outcome but does not equalise it. The photosynthetic work done in the first half of the cycle -- canopy establishment, root system development -- is light-dependent and is not recovered by moving the plant to better light later. Rotation is a mitigation, not a solution.
During monsoon months (May through October), the ambient scatter contribution to lower tiers disappeared almost entirely on overcast days, which in monsoon season can account for 60 to 70 percent of daytime hours. Without ambient scatter, tier 5 was frequently running at 2,200 lux for the majority of the light period. The tiers above were compensating with higher ambient contribution on clear days; the tiers below were not. The seasonal monsoon effect amplified the gradient in ways that are invisible if lux is only mapped during clear-weather calibration sessions. Plant Mood grow log data, 2023 to 2024.
The lux gradient worsened faster during monsoon season than the inverse square law alone predicts
A BH1750 mapping done during a clear-weather period in the dry season will significantly understate how severe the gradient becomes during monsoon. If the tower is producing inconsistent results across seasons, the monsoon-amplified light gradient at the lower tiers is the first thing to measure, not the last.
Plant Mood grow log data, 2023 to 2024
What growers miss when they treat a 5-tier tower as a single grow environment
In a tower with a shared reservoir, the EC reading reflects the average consumption across all tiers. Top-tier plants consuming at a high rate and bottom-tier plants consuming at a low rate produce a blended drawdown signal that makes both look like they are operating at the same feeding intensity. The EC schedule that results is calibrated for the average, which means it is slightly over-supplying the bottom tiers and slightly under-supplying the top tiers relative to their actual photosynthetic demand. Neither problem is visible in the reservoir log alone -- you need per-tier yield data or separate reservoir containers to see it.
The shared reservoir masks per-tier EC imbalance
The most common BH1750 placement in a tower setup is above the canopy or mounted to the frame at the top of the unit -- convenient for wiring and for seeing the reading on a display, but measuring incident light at a point where no planting site exists. Our mapped data showed that a sensor positioned above the tier 1 canopy reads 800 to 1,400 lux higher than a sensor positioned at the tier 1 planting site itself, because the canopy is intercepting light before it reaches the site. A sensor above the canopy tells you what the light is doing at ceiling level. A sensor at the planting site tells you what the plant is actually receiving. These are consistently different numbers.
Sensor placement that measures what the grower sees, not what the plant sees
At transplant, the vertical light gradient is driven primarily by distance from the light source. By week two, a second gradient layer has been added: canopy shadow from the upper tiers. This is a dynamic variable -- the shadow gradient intensifies as the crop matures, meaning the light environment the lower tiers experience in week three is meaningfully worse than what they experienced in week one. A single calibration mapping done at transplant will not represent the conditions under which most of the productive growth and nutrient consumption occurs.
The canopy shadow gradient that builds across the crop cycle
Adding more wattage above a 5-tier tower scales all tier readings upward but does not change the gradient ratio. If tier 1 reads 70 percent more than tier 5 at 45W, it will also read 70 percent more at 90W. The physics of light distribution from a single point source does not change with wattage -- the inverse square law applies equally at both power levels. A grower who upgrades from a 45W to a 90W overhead LED and expects the bottom tiers to become viable growing environments will find that tier 5 doubles its lux reading but remains proportionally as disadvantaged relative to tier 1 as before.
The assumption that a higher-wattage overhead light solves the gradient
Tower problems that are actually light distribution problems
'My top tiers grow fast and my bottom tiers are always slow. I thought it was the roots or the water temperature near the reservoir.'
Almost certainly light. In a 5-tier tower with a single overhead source, the lux gradient between tiers 1 and 5 routinely exceeds 60 percent. Root zone temperature near the reservoir and water temperature gradients exist but account for a much smaller performance differential than the light difference. Put a BH1750 at each tier level before assuming the cause is below the canopy. In every tower setup we have mapped, the lux data explains the yield gradient better than any other single variable.
'I measured the lux above my tower and it reads fine. But the plants at the bottom still underperform.'
The sensor is in the wrong position. Lux measured above the canopy does not represent lux at the planting site -- the canopy intercepts light between the sensor and the plant. A reading taken above tier 1 tells you what is arriving at the top of the system. It says nothing about what reaches tiers 4 and 5 after passing through or around the canopy layers above. The BH1750 needs to be at each planting row, oriented as the leaf surface faces the light, to produce a reading that is relevant to plant performance.
'I rotate my plants between tiers every week to give them even light exposure. The top and bottom still do not perform the same.'
Rotation averages total light exposure across the cycle but does not equalise it. Plants that spend the first week in the bottom tier during early establishment accumulate a photosynthetic deficit that affects canopy development and root mass. When moved to the top tier in week two, they are a less developed plant entering better light conditions -- they improve, but they do not recover to the baseline of a plant that had the better light from the start. The rotation benefit is real but the deficit is not fully reversible mid-cycle.
'The grow light manufacturer says the light covers my tower footprint at the recommended hanging height. But the bottom tiers are still dark.'
Coverage footprint ratings on grow lights measure the area at a single specified distance from the source -- typically 30 to 60 cm. A 5-tier tower extends 100 to 150 cm in vertical depth. The coverage claim is accurate for the top tier and progressively less applicable to each tier below. The manufacturer is not describing light distribution across vertical depth -- they are describing horizontal coverage at one distance. These are different specifications and the difference is what produces the bottom-tier problem.
A higher-wattage overhead light does not fix the bottom tiers
Light intensity from a point source falls off with the square of the distance -- this is the inverse square law, and it applies identically regardless of the source power. If tier 5 reads 30 percent of tier 1 at 45W, it will read 30 percent of tier 1 at 90W. The absolute lux values scale up proportionally, but the gradient ratio does not change. You are spending twice the electricity and generating more heat in the grow space -- which in Bangkok is an active problem, not a neutral cost -- while the structural disadvantage of the lower tiers remains identical.
The only interventions that actually change the gradient ratio are changing the light geometry (adding a secondary source at mid-tower height) or changing the tower geometry (reducing the number of tiers, or reducing the tier spacing so the vertical depth is smaller). Both are structural changes, not power changes.
We tested the 45W-to-90W upgrade on the same tower with the same BH1750 mapping protocol. Tier 1 went from 7,400 to 14,600 lux -- roughly as expected. Tier 5 went from 2,200 to 4,300 lux -- also roughly as expected. The tier 1-to-5 ratio at 45W was 3.36:1. At 90W it was 3.40:1. The gradient was functionally identical. What changed was the ambient temperature in the grow room increased by 2.1 degrees Celsius -- which in Bangkok is a meaningful shift toward reservoir heat stress. The 90W overhead produced a worse overall growing environment than the 45W plus a 25W secondary at mid-tower height, at the same total wattage. Plant Mood grow log data, 2024.
The solution to insufficient light at the lower tiers of a tower is a more powerful overhead light. If the bottom tiers are reading 2,200 lux and the plants need 4,000, double the wattage and the problem is solved. More power above means more light everywhere.
How to map and respond to the light gradient on a 5-tier tower
Any grower running a 5-tier tower who has not mapped per-tier lux
Do the mapping before anything else. Take a BH1750 and position it at each planting site in turn -- not above the canopy, not at frame level, but at the site itself, oriented as a leaf surface faces the light. Log the reading at the same time of day across three consecutive days and average the results. Do this at week one of a crop cycle and again at week two, because the canopy shadow adds a second gradient layer that the week-one mapping will not capture.
A tier-by-tier lux profile that tells you whether your lower tiers are above or below the threshold where lux-driven EC depletion is predictable (in our data, 4,200 lux). This is the number that determines whether your tower has a light problem or whether the gradient is within a manageable range.
Growers whose mapping shows tiers 4 and 5 below 3,500 lux under their current light setup
Add a secondary light source positioned at tier 3 height, aimed at a downward angle covering tiers 3 through 5. A 20 to 30W LED bar at this position produces a larger gradient reduction than upgrading the overhead unit to twice the wattage. The secondary light closes the ratio rather than scaling it. Test with the BH1750 before committing to a permanent mounting position -- small adjustments in angle and height produce meaningful lux differences at the lower tiers.
A reduction in the tier 1-to-5 lux ratio from the typical 3:1 or 4:1 range toward a 1.5:1 to 2:1 range. Above 4,000 lux at tier 5, EC depletion behaviour at the lower tiers begins to track lux reliably and the feeding schedule becomes applicable across the full tower.
Growers managing a shared reservoir across all five tiers
Assign your most light-demanding crops -- basil, anything with high secondary metabolite production -- to tiers 1 and 2. Crops with lower light saturation points -- kale, some herbs, crops you are growing for leaf mass rather than flavour intensity -- go to tiers 3 through 5. This does not solve the gradient but it matches crop light requirements to the available distribution, which reduces the performance gap between tiers without any change to the lighting hardware.
A tower where the per-tier yield gap is narrowed by crop selection rather than hardware. The light gradient remains; the mismatch between what each tier needs and what it gets is reduced.
Growers in Bangkok running towers through monsoon season
Do a second lux mapping during a monsoon overcast day, with blinds closed to isolate the artificial light contribution. Compare it to your clear-day mapping. If the clear-day ambient scatter was contributing more than 1,000 lux to your lower tiers, your monsoon-season light environment is meaningfully different from your dry-season calibration. The feeding schedule, rotation interval, and crop assignment that worked in February may produce inconsistent results in July for exactly this reason.
A monsoon-specific lux profile that reflects actual growing conditions during the most light-variable months of the Bangkok year. With both profiles logged, the seasonal shift in tier performance becomes a predictable pattern rather than an unexplained yield inconsistency.
The week-two re-mapping. Growers who map lux at transplant, see acceptable numbers across the tiers, and do not check again are missing the canopy shadow gradient that builds as the crop matures. The mapping that matters most is the one taken at week two, when the canopy is established and intercepting meaningful amounts of light before it reaches the lower tiers. A week-one map and a week-two map together give you the actual gradient range the tower operates across. One without the other is half the picture.
FAQ
How much does lux drop from the top to the bottom of a 5-tier hydroponic tower?
In our BH1750 mapping of a 5-tier tower under a single 45W overhead LED, lux dropped from 7,400 at tier 1 to 2,200 at tier 5 -- a 70 percent reduction. The gradient was not uniform: the steepest single-tier drop was between tiers 2 and 3, where canopy shadow from the upper tiers compounded the inverse square law distance effect. Plant Mood grow log data, 2024.
Where should I position a BH1750 sensor on a hydroponic tower to get accurate lux readings?
At the planting site itself, oriented as the leaf surface faces the light source -- not above the canopy and not at frame level. A sensor positioned above the canopy reads incident light before the canopy intercepts it. In our mapped data, above-canopy readings were 800 to 1,400 lux higher than at-site readings for the same tier. The number that matters for predicting plant performance and EC depletion is the reading at the planting site.
Does upgrading to a more powerful overhead grow light fix the light gradient problem on a vertical tower?
No. Light intensity follows the inverse square law -- doubling the wattage doubles the absolute lux at every tier but does not change the ratio between tiers. In our testing, a 45W and a 90W overhead LED produced a tier 1-to-tier 5 ratio of 3.36:1 and 3.40:1 respectively -- functionally identical. The 90W unit also raised ambient room temperature by 2.1 degrees Celsius. A secondary light source at mid-tower height is more effective and produces less heat load. Plant Mood grow log data, 2024.
Which tier on a 5-tier hydroponic tower is the light inflection point?
Tier 3, in our mapped setup. Above tier 3, lux was sufficient to keep EC depletion rate tracking predictably with light intensity. Below tier 3, both tiers 4 and 5 dropped below 4,200 lux -- the threshold in our data where the lux-to-EC depletion correlation breaks down. Tier 3 itself read 4,100 lux, putting it at the edge of the reliable zone. Plant Mood grow log data, 2024.
Does rotating plants between tower tiers equalise light exposure and fix yield differences?
Partially, but not fully. Rotation averages total light exposure across the cycle but does not reverse deficits accumulated in the early growth phase. In two tested cycles with mid-cycle tier swaps, plants that started in the lower tiers and moved up outperformed full-cycle bottom-tier plants but did not reach the yield of full-cycle top-tier plants. Early canopy development and root establishment are light-dependent and the deficit does not recover when the plant moves to better light later. Plant Mood grow log data, 2024.
How does Bangkok monsoon season affect light distribution across tower tiers?
It amplifies the gradient. On clear days, ambient scatter from a south-facing window adds 1,200 to 3,800 lux to the lower tiers. On monsoon overcast days, that contribution disappears and the lower tiers fall back to receiving only overhead LED light -- in our data, 2,200 lux at tier 5. Upper tiers compensate with higher ambient contribution on clear days; lower tiers do not. A tower that performs consistently in the dry season may show bottom-tier deterioration during monsoon for exactly this reason. Plant Mood grow log data, 2023 to 2024.
What is the most effective way to reduce the lux gradient on a 5-tier hydroponic tower?
Adding a secondary light source at mid-tower height aimed at tiers 3 through 5. In our test configuration, a 25W secondary LED at tier 3 height reduced the tier 1-to-5 lux ratio from 3.36:1 to approximately 1.9:1, bringing tier 5 from 2,200 to 4,800 lux. Total wattage increased by 56 percent but the gradient reduction was 70 percent. The same total wattage spent on a single larger overhead unit produced a ratio of 3.40:1 -- no improvement. Plant Mood grow log data, 2024.