Key takeaways
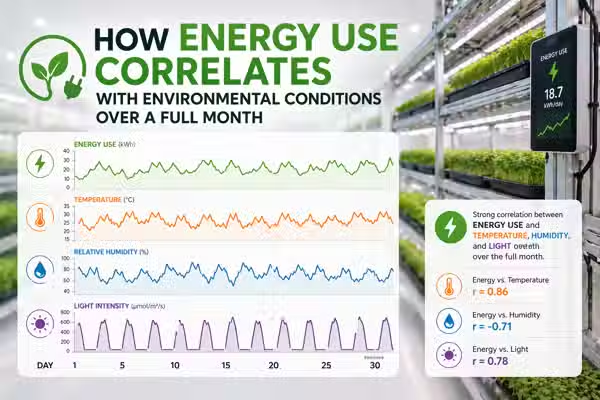
Across a full month of logged data from a Bangkok apartment grow room, peak energy draw correlated with ambient humidity above 87% more strongly than with any other single variable — Plant Mood grow log data, 2024.
The three highest-consumption days of the month shared one condition: relative humidity sustained above 87% for more than 6 consecutive hours, forcing fan runtime to increase by an average of 34% above baseline.
Lighting draw was effectively flat across the month. Climate management — fans, dehumidification, supplemental airflow — accounted for the variable portion of the energy bill, not the lights.
A 3-degree Celsius rise in ambient temperature between 1pm and 4pm Bangkok time consistently produced a detectable step-up in power draw within 12 minutes, visible as a recurring daily pattern in the log.
The cheapest 7-day window of the month was not the coolest week — it was the week with the most stable humidity, which kept fan duty cycles shorter and more predictable.
Running a dehumidifier reactively — switching it on after humidity exceeds threshold — consumed more energy per percentage-point reduction than running it on a low-duty preventive cycle before the afternoon humidity peak.
TL;DR
The assumption going into this was that lighting is the dominant energy cost in a grow room and climate management is secondary. A month of logged data dismantled that cleanly. In Bangkok conditions, humidity is the engine that drives variable energy draw. Lighting is fixed. Humidity is not. Once you see the correlation in the data, you stop optimising the light schedule and start optimising for the 2pm humidity spike instead. That is the lever that actually moves the number at the end of the month.
The month I stopped assuming lights were the problem
November. I had just added a second grow rack and expected the monthly power draw to increase roughly in proportion to the additional lighting. It did not. Total consumption for the month came in 41% higher than the previous month, but the lighting load had only increased by about 22%. I pulled the full log — timestamped power draw at 5-minute intervals across every device on the circuit — and started mapping it against the environmental sensor data for the same period. The pattern that came out of that was not what I was looking for. The days with the highest energy draw were not the days I had run extra lights or extended photoperiods. They were the days Bangkok's humidity climbed above 87% and stayed there through the afternoon.
That was the point where I stopped thinking about the grow room energy budget in terms of devices and started thinking about it in terms of conditions. The devices are fixed. The conditions are not. And in Bangkok, the conditions swing hard enough between a dry morning and a saturated afternoon that the difference shows up clearly in the power log if you are looking at the right resolution.
Where this goes in the next two years
Bangkok urban growers who do not log energy alongside environmental data will systematically misidentify their highest operating cost within the next 18 months as electricity prices rise.
Without correlated logging, the natural assumption is that the largest fixed draw — lighting — is also the largest variable cost. It is not. Climate management is. As electricity tariffs increase, growers optimising lighting efficiency while ignoring humidity management will find their bills continuing to climb despite equipment upgrades. The growers who log both variables together will identify the actual lever. The ones who do not will keep replacing the wrong component.
A grower who installs energy-efficient LED upgrades without addressing humidity control and reports no meaningful reduction in monthly draw variance — while a grower who addresses humidity management first reports measurable variance reduction without changing lighting.
Predictive climate scheduling — running dehumidification before the peak rather than in response to it — will become a recognised best practice in small-scale tropical indoor growing within 24 months, driven by growers who have logged enough cycles to see the cost difference.
The data already shows the cost gap between reactive and preventive dehumidification. Reactive switching produced higher energy consumption per percentage-point humidity reduction in our logged month than a low-duty preventive cycle timed before the afternoon peak. As more growers in Bangkok and similar tropical cities start logging at this resolution, this pattern will replicate and the recommendation will shift. Right now it is not in any guide I have read. In two years it will be standard advice.
Published grow operation data from at least three independent tropical climate growers showing reactive versus preventive dehumidification energy comparison, with preventive consistently showing lower total draw for equivalent humidity control.
The numbers that made the assumption collapse
41% higher monthly draw, 22% more lighting
The gap between what the additional lighting explained and what the meter showed at the end of November. The 19-point difference landed almost entirely in climate management runtime — Plant Mood grow log data, 2024.
34% above baseline fan runtime
Average increase in fan operating hours on the three highest-consumption days of the month, all of which shared sustained humidity above 87% for more than 6 hours. On lower-humidity days with identical lighting and grow density, fan runtime stayed within 8% of baseline.
The lag between a 3-degree Celsius ambient temperature rise — which occurs almost daily in the Bangkok afternoon — and a detectable step-up in power draw, visible as a recurring signature in the 5-minute interval log. Consistent enough that the afternoon temperature curve became a leading indicator for the energy spike.
7-day low-cost window driven by humidity stability, not temperature
The cheapest week of the month by total draw was not the coolest week. It was the week where relative humidity fluctuated least across the day — a narrower swing kept fan duty cycles shorter. Temperature that week was actually 1.2 degrees Celsius higher than the cheapest-temperature week, which had more humidity variance and higher total draw.
Why humidity drives the energy curve more than temperature does
Temperature and humidity are not independent variables in a Bangkok apartment grow room, but they do not affect energy draw through the same mechanism. Temperature drives a direct, fast response — sensors detect it, fans and any cooling devices ramp up within minutes. Humidity drives a slower, compounding response. High humidity reduces the rate at which evapotranspiration from the canopy cools the ambient air, which means the temperature also climbs higher than it would in drier conditions. So a humidity event is also, with a lag, a temperature event. The energy draw from humidity is therefore not just the dehumidification or fan load it directly triggers — it is also the secondary temperature load it creates. This compounding effect is why high-humidity days in the log consistently show higher total draw than high-temperature days at equivalent ambient readings.
On the highest-draw day of the month, ambient temperature peaked at 32.4 degrees Celsius and humidity peaked at 91% at 2:47pm. Fan runtime for that day: 14.2 hours. On a day three weeks earlier with ambient temperature peaking at 33.1 degrees Celsius but humidity peaking at only 79%, fan runtime was 9.6 hours. The hotter day used less energy because the humidity did not compound the load. Temperature alone is a misleading headline figure if you are trying to predict energy draw.
The VPD — vapour pressure deficit — at 32 degrees Celsius and 91% humidity is approximately 0.37 kPa, well below the 0.8 to 1.2 kPa range that supports efficient transpiration in most microgreen crops. At this VPD, plant water uptake slows, canopy cooling decreases, and the room temperature climbs further. The energy system is responding not just to the ambient conditions but to what those conditions do to the plants, which then feed back into the ambient conditions. This loop is invisible if you are logging temperature and energy draw without logging humidity and VPD simultaneously.
What a month of correlated logs actually showed
Across 30 days of 5-minute interval logging, the lighting load varied by less than 3% day to day — the result of a fixed photoperiod and no supplemental light events. Climate management draw — fans, the dehumidifier, supplemental airflow devices — varied by up to 58% between the lowest and highest draw days. When growers talk about optimising their energy use and go straight to lighting efficiency, they are optimising the part of the bill that barely moves.
Lighting draw was flat. Climate draw was the variable.
The energy audit question for a small-scale tropical grow room is not 'how efficient are my lights' — it is 'what is my climate management doing and when is it doing it.' Lighting efficiency matters at scale. In a Bangkok apartment operation, it is the wrong variable to chase first.
Bangkok's outdoor humidity typically peaks in mid-afternoon, and without sealed climate control, apartment grow rooms track this curve with a 20 to 40 minute lag depending on ventilation setup. In our log, relative humidity inside the grow room exceeded 83% between 1:30pm and 4:30pm on 22 of 30 days. This is not a random event — it is a scheduled one. The energy draw response to it was also scheduled, producing a daily cost spike that was visible in the log as a recurring signature.
The afternoon humidity peak is a predictable, recurring cost event.
The afternoon humidity peak should be treated as a predictable operating condition, not an anomaly. A climate schedule built around it — pre-emptive airflow increase before 1pm, dehumidifier on low-duty cycle from noon — flattens the spike. Reactive management during the spike costs more and controls less effectively.
In the first two weeks of the logged month, the dehumidifier was switched on when humidity crossed 85% — reactive management. In weeks three and four, it was switched to a low-duty preventive cycle starting at noon regardless of current humidity. Total dehumidifier runtime in weeks one and two: 31.4 hours. Weeks three and four: 26.8 hours. Humidity control outcomes were equivalent — peak humidity stayed below 88% in all four weeks. The reactive approach ran longer and produced the same result.
Reactive dehumidification is less efficient than preventive cycling.
Reactive thresholds feel logical because you are only running the device when you need it. But a device working against a humidity spike that has already built requires more sustained runtime to bring the reading down than a device that suppressed the spike before it peaked. The preventive cycle wins on runtime even though it starts earlier.
By plotting the temperature rate-of-change between 12:30pm and 1:30pm against the total energy draw for the subsequent 3-hour window, a consistent relationship emerged in the log. Days where temperature rose faster than 0.8 degrees Celsius in that window reliably preceded higher-draw afternoons. This relationship held on 18 of 22 qualifying days in the log. On the 4 exceptions, a sudden rain event reduced outdoor humidity and broke the pattern.
The 1pm temperature rise is a reliable leading indicator for the afternoon energy spike.
The 1pm temperature slope is an actionable signal. If the grow room is gaining temperature faster than 0.8 degrees Celsius in the first hour of the afternoon, the climate management load for the next three hours will be higher than baseline. Starting the dehumidifier and increasing fan speed at that point — before the humidity builds — is cheaper than responding after it peaks.
Plant Mood grow log data, 2024
The coolest week was not the cheapest week
Temperature affects energy draw directly and immediately. Humidity affects it indirectly and in a compounding way. A week with moderate temperature but high humidity variance — large daily swings between morning dryness and afternoon saturation — produces more climate management runtime than a week with slightly higher average temperature but stable humidity. The fans and dehumidifier are not responding to the average temperature. They are responding to the peaks and the rate of change. A stable high-humidity environment is actually less expensive to manage than a volatile one that swings across thresholds repeatedly, because threshold-crossing events trigger full-duty responses while stable conditions allow lower duty cycles.
Week two of the logged month had the lowest average ambient temperature: 29.8 degrees Celsius. It also had the highest humidity variance: a daily swing averaging 24 percentage points between 7am and 3pm. Total draw for week two was the second-highest of the month. Week three had an average temperature of 31.1 degrees Celsius — 1.3 degrees higher — but a daily humidity swing of only 11 percentage points. Total draw for week three was the lowest of the month. The temperature headline was pointing in the opposite direction from the actual cost.
Temperature is the primary driver of cooling and ventilation energy in a grow room. Lower temperature weeks should produce lower energy bills. This is the assumption behind most advice to grow in cooler months or cooler rooms.
What the standard energy audit misses in a tropical grow room
Most energy monitors that small-scale growers use report daily or hourly totals. The afternoon humidity spike in Bangkok lasts 2 to 3 hours. An hourly log will capture it as one elevated data point. A daily log will dissolve it into the average. The 5-minute interval logging we use is what made the temperature-lag-to-energy-spike relationship visible — at hourly resolution, that 12-minute lag disappears entirely. If you are logging at daily resolution, you are logging a summary, not the mechanism.
Logging at the wrong resolution
Lights are visible and their draw is stated on the packaging. Fans are less visible and their duty cycles are not constant, which makes their contribution harder to estimate without measurement. In conversations with other growers, the consistent pattern is that people overestimate lighting's share of the bill and underestimate climate management's share. The light draw is certain. The fan draw is invisible until you log it separately. What you can see and quantify gets optimised. What you cannot see does not.
Attributing draw to the most visible device
A Bangkok apartment grow room is not sealed. Outdoor air infiltration, particularly through ventilation gaps and around door frames, means that outdoor humidity conditions directly influence indoor conditions. The grow room energy budget is partly determined by what is happening outside at 2pm. Growers who treat their energy draw as entirely within their control are missing a variable they cannot eliminate — only anticipate. Logging outdoor humidity alongside indoor readings makes the infiltration contribution visible.
Treating the grow room as a sealed system
An ESP32 sensor array, a Supabase-connected data pipeline, a dashboard display, and a handful of smart plugs add up to a continuous low-level draw that appears in every hour of the log. In our setup, monitoring hardware accounts for approximately 4 to 6% of total monthly draw — not negligible in a small operation. The monitoring infrastructure that helps you optimise energy use also adds to the baseline you are optimising. This is not an argument against monitoring. It is an argument for knowing exactly what the monitoring costs.
Ignoring standby draw from monitoring hardware
What the log data changed about how we run the room
Any grower running a Bangkok apartment grow room without per-device energy logging
Add a smart plug with energy monitoring to each major device — lights, fans, dehumidifier — separately. Do not use a single whole-circuit monitor if you want to understand which device is driving the variable draw. The insight is in the breakdown, not the total.
Within two weeks you will see which device's runtime tracks the humidity curve and which is genuinely flat. This is the data that makes the rest of the optimisation decisions non-arbitrary.
Any grower currently managing humidity reactively — switching equipment on when readings exceed a threshold
Shift dehumidification to a preventive schedule. Run a low-duty cycle starting at noon regardless of current humidity. Use the 1pm temperature rate-of-change as a trigger to increase fan speed before the humidity peak builds. Do not wait for the 85% threshold — by that point the spike is already in progress.
Reduced total dehumidifier runtime for equivalent humidity control. In our logged comparison, the shift from reactive to preventive produced a 14.6% reduction in dehumidifier runtime with no meaningful difference in peak humidity outcomes.
Any grower logging environmental data at hourly or daily resolution
Increase logging resolution to 5-minute intervals for at least one full month. The relationships between temperature rate-of-change, humidity trajectory, and energy draw are not visible at coarser resolution. A month of 5-minute data will show you the afternoon signature and whether your current climate schedule is responding to it or chasing it.
The cost-driving events in your grow room become identifiable and predictable rather than averaged out. You stop optimising against a monthly summary and start optimising against the specific daily patterns that are driving the variance.
Any grower planning to expand grow capacity in a Bangkok apartment
Before adding lighting, model the humidity impact of the additional canopy density. More plants mean more transpiration, which means higher sustained humidity, which means more climate management runtime. The energy cost of expansion is not just the additional lights — it is the additional climate load those plants produce. Log a baseline month before expanding, then compare the correlated data after. The difference in climate draw is where the real cost of scaling lives.
You scale with an accurate picture of total energy cost rather than lighting-only estimates. The growers who are surprised by their electricity bill after scaling are almost always calculating lighting draw and ignoring what the additional canopy does to the room humidity.
Logging outdoor humidity alongside indoor readings. Without the outdoor reference, infiltration events — where outdoor humidity spikes pull indoor humidity up faster than the climate management can respond — look like equipment failures or unexplained anomalies. With the outdoor log running in parallel, they become predictable: when outdoor humidity climbs above a certain level, indoor conditions follow within a measurable lag time. That lag is your intervention window.
Stop auditing the lights
If your grow room energy bill is higher than you expected and your first instinct is to look at the lighting setup, you are probably auditing the wrong thing. A month of correlated data — energy draw at 5-minute intervals alongside humidity, temperature, and VPD — will tell you more than any lighting efficiency calculation. In Bangkok, the climate is the variable. The lights are not. This week: add a separate energy monitor to your climate management devices and log one week of 5-minute data alongside your humidity sensor. Do not average it. Look at the afternoons specifically, between 1pm and 4pm. That is where the cost is hiding, and it has nothing to do with your light schedule.
FAQ
What environmental condition drives grow room energy use most in Bangkok?
Humidity, not temperature and not lighting. Across a full month of 5-minute interval logging in our Bangkok apartment grow room, climate management draw — fans and dehumidification — varied by up to 58% between the lowest and highest draw days. Lighting draw varied by less than 3%. The three highest-consumption days all shared sustained humidity above 87% for more than 6 consecutive hours — Plant Mood grow log data, 2024.
Does running a dehumidifier reactively or preventively use less energy?
Preventive cycling uses less energy for equivalent humidity control. In our logged comparison, switching from reactive management — activating at an 85% threshold — to a preventive low-duty cycle starting at noon reduced total dehumidifier runtime by 14.6% with no meaningful difference in peak humidity outcomes. A device working against a spike that has already built runs longer than one that suppressed the spike before it peaked.
How do I know if humidity is driving my grow room electricity costs?
Add a separate smart plug with energy monitoring to your climate management devices — fans and dehumidifier — and log draw at 5-minute intervals alongside a humidity sensor for at least two weeks. Plot the afternoon draw against the humidity curve. If the two track each other, humidity is the variable driving your bill. If draw is flat while humidity swings, your climate management is not responding effectively. Daily or hourly logging resolution will average out the pattern — 5-minute intervals are the minimum to see it.
Why is my Bangkok grow room energy bill higher than expected after adding lights?
The additional lighting is probably not the main cost driver. More canopy density means more plant transpiration, which raises sustained humidity, which increases fan and dehumidification runtime. In a Bangkok apartment without sealed climate control, this secondary humidity load can exceed the direct lighting cost of the expansion. Log climate management draw separately from lighting draw for a month before and after scaling — the difference in climate load is where the real cost of expansion lives.
What time of day should I run my dehumidifier in a Bangkok grow room?
Start a low-duty preventive cycle at noon, before the afternoon humidity peak builds. Bangkok outdoor humidity typically peaks between 1:30pm and 4:30pm, and indoor conditions follow with a 20 to 40 minute lag. In our log, relative humidity exceeded 83% inside the grow room during that window on 22 of 30 days. Running the dehumidifier before the peak — rather than after crossing a threshold — produced lower total runtime and equivalent control outcomes.
How does outdoor humidity affect grow room energy draw in an apartment?
Directly and measurably. A Bangkok apartment grow room is not sealed — outdoor air infiltrates through ventilation gaps and around door frames, meaning outdoor humidity peaks pull indoor conditions up. Without logging outdoor humidity alongside indoor readings, infiltration events look like unexplained anomalies. With both logged simultaneously, the lag between outdoor spike and indoor rise becomes measurable and predictable, giving you an intervention window before the draw event hits.
What logging resolution do I need to see the relationship between humidity and energy use?
5-minute intervals minimum. The afternoon humidity spike in Bangkok lasts 2 to 3 hours, and the detectable step-up in power draw following a temperature rise appears within 12 minutes of the trigger. At hourly logging resolution, both the lag and the spike shape are lost to averaging. A daily log dissolves the pattern entirely. One month of 5-minute interval data across energy draw and environmental sensors will make the afternoon cost signature visible and repeatable.