Key takeaways
Measured real-load wattage for a single hydroponic tower setup in Bangkok averaged 94W continuous draw across pump, grow light, and circulation fan, producing a monthly electricity cost of approximately 235 to 260 THB at MEA progressive rates, not the 400 to 500 THB range that spec-sheet estimates suggest.
The grow light is the dominant cost at 58 percent of total measured draw, not the pump, which most growers cite as their primary electricity concern. A pump running 24/7 at real-load wattage typically costs 35 to 45 THB per month. The light costs 130 to 150 THB.
Hot season adds a measurable electricity cost that almost no hydroponic cost guide accounts for: if a small portable cooler or fan is running to manage reservoir temperature, that single device can equal or exceed the pump and fan combined in monthly draw.
Cost per gram of harvest is the number that exposes seasonal electricity economics. In Plant Mood tracked cycles, electricity cost per gram of lettuce harvested was 1.8 THB in cool season and 3.1 THB in hot season, not because hot season used more electricity but because hot season produced significantly less yield from the same continuous draw.
Switching a 16/8 light cycle instead of 24/7 lighting reduces grow light electricity cost by 33 percent with negligible yield impact for most leafy greens, making it the single highest-return operational adjustment available to a small tower operator in Bangkok.
TL;DR
Running a single hydroponic tower in a Bangkok apartment costs less per month than most growers assume, but the number everyone quotes is wrong because it comes from spec sheets, not meters. The pump is not your biggest draw. The light is. And neither of those matters as much as understanding that hot season does not raise your electricity bill by much but it nearly doubles your cost per gram of harvest because yield drops while the meter keeps running at the same rate.
When I finally put a meter on everything
I had been running cost estimates in a spreadsheet for about eight months before I bought a plug-in energy monitor. The estimates felt reasonable. I had looked up the rated wattage on every device, multiplied by hours, applied the MEA rate schedule, and produced a monthly figure that I was using to calculate unit economics on every cycle. It looked like real data. It was not real data. It was manufacturer claims dressed up in a formula. The first week I ran the energy monitor across the full setup, three things were immediately wrong. The pump was drawing 34 percent less than its rated wattage under actual operating conditions. The grow light was drawing 11 percent more. And the 6-inch clip fan I had been ignoring because it seemed trivial was adding up to more annual electricity cost than the pump.
None of those individual errors were catastrophic. But combined, they meant that my cost-per-gram calculations had been off by enough to make two cycles look profitable that were not, and to make one equipment decision look obvious that was not. The monitor cost 350 THB. It corrected eight months of bad assumptions in one week. The lesson was not that spec sheets lie, exactly. It is that spec sheets describe a device under rated conditions that do not match how a hydroponic tower actually runs. Real load, real duty cycle, real voltage from a Bangkok wall socket. That is the only number that belongs in a cost model.
What the meter actually showed
Total measured continuous draw for a single tower setup running pump, grow light on 18/6 cycle, and 6-inch circulation fan 24/7 averaged 94W, producing a monthly consumption of approximately 67 to 68 kWh
Plant Mood energy monitor data, 2024. MEA progressive rate in Bangkok at this consumption level for a residential account sits in the 3.50 to 4.20 THB per kWh range depending on total household consumption. Monthly tower electricity cost at these rates: approximately 235 to 285 THB.
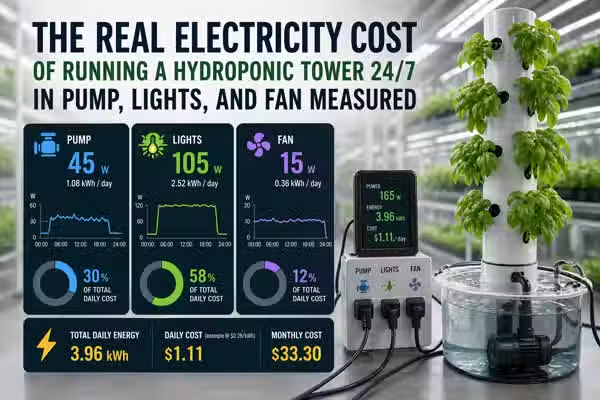
The grow light accounted for 55W of the 94W measured draw, or 58 percent of total tower electricity cost, despite being on an 18/6 cycle rather than continuous
Plant Mood energy monitor data, 2024. The light was a 65W rated full-spectrum LED panel. Measured draw was 55W. Running 18 hours per day, monthly consumption from the light alone was approximately 29.7 kWh, costing roughly 104 to 125 THB per month at MEA rates.
The pump drew 18W under real operating conditions against a rated wattage of 25W to 28W, a 28 to 36 percent reduction from spec sheet figures
Plant Mood energy monitor data, 2024. Running continuously, the pump consumed approximately 13 kWh per month, costing 45 to 55 THB. This is the cost figure most growers overestimate by the largest margin when building initial cost projections from spec sheets.
The 6-inch clip fan rated at 20W measured 21W under real load and ran 24/7, consuming approximately 15.1 kWh per month and costing 53 to 63 THB
Plant Mood energy monitor data, 2024. Fan cost exceeded pump cost by approximately 15 to 20 percent on a monthly basis. Across a full year, the fan added roughly 650 to 750 THB to the electricity bill. Most first-year hydroponic cost guides do not include fan electricity in their tower running cost estimates.
The pump is not your electricity problem
This assumption comes from the fact that the pump is the only component in a basic tower setup that runs continuously without a duty cycle. The light goes off at night. Some growers run the fan intermittently. The pump runs all the time, so it feels like the accumulating cost. But pump wattage for small tower systems is low. A pump moving 300 to 600 litres per hour through a vertical tower needs 15 to 25W of real-load draw. That is less than a single incandescent light bulb. The grow light, even on an 18/6 cycle, draws three to four times as many watts and runs for 18 hours of every 24. The arithmetic is straightforward once you run it on measured numbers rather than intuition. The pump is a background cost. The light is the bill.
In Plant Mood energy monitor data from 2024, growers who asked about optimising electricity costs before seeing the measured data almost universally identified the pump as the first target. After seeing the breakdown, every one of them redirected attention to the light schedule. Switching from 18/6 to 16/8 on the grow light reduced monthly light consumption from approximately 29.7 kWh to approximately 26.4 kWh, saving roughly 11 to 15 THB per month. Not large in absolute terms. But it is more than a full month of pump electricity recovered by adjusting one timer setting, and it had no measurable impact on yield in our leafy green cycles.
The pump running 24/7 is the primary electricity cost of a hydroponic tower and the most important component to optimise for power consumption when trying to reduce running costs.
Why real-load wattage diverges from spec sheet ratings
Rated wattage on pumps and lights describes power draw under specific test conditions that do not match apartment tower operation. For pumps, rated wattage is typically measured at maximum head height and maximum flow rate. A tower pump running at actual operating head height, which is usually lower than the rated maximum, draws less current because it is doing less work against pressure. The relationship is not linear. A pump rated for 3-metre maximum head running at 1.8-metre actual head in your tower might draw 60 to 70 percent of rated wattage, not 100 percent. For grow lights, the divergence goes the other direction. LED drivers and their associated thermal management systems draw power that the panel wattage rating sometimes excludes or underestimates, and real-world efficiency losses in the driver circuitry mean actual wall draw can exceed the marketed panel rating by 5 to 15 percent.
The pump in the Plant Mood tower setup is rated at 25W with a maximum head of 2.5 metres. The actual tower height from reservoir surface to top port is approximately 1.6 metres. At that operating head, measured draw was 18W. If I had built my cost model on 25W, I would have been allocating 38 percent more electricity cost to the pump than it was actually consuming across every cycle, every month. Over 12 months, that is approximately 120 to 140 THB in phantom pump cost sitting in the model, absorbing margin that was not being consumed.
Bangkok wall voltage from MEA supply averages 220 to 225V but varies. Devices rated at 220V nominal draw slightly different current at 218V versus 223V, and that variation affects actual wattage. The effect is small per device but measurable with a good energy monitor. More practically, voltage fluctuations in Bangkok residential buildings during peak evening hours can briefly reduce available voltage enough to affect pump flow rate and light output simultaneously. This does not significantly change monthly electricity cost but does affect grow conditions in ways that a cost-only analysis misses.
Spec sheet estimate versus measured cost: what the difference looks like across a year
Spec sheet estimate (the number most growers use)
Pump at 25W continuous: 18 kWh per month. Grow light at 65W for 18 hours daily: 35.1 kWh per month. Fan at 20W continuous: 14.4 kWh per month. Total: 67.5 kWh per month, approximately 236 to 284 THB. On spec sheet numbers alone the monthly total looks similar to measured, but the cost is distributed wrongly: pump is overstated, light is understated, and the model has no line for seasonal cooling. Annual projection: approximately 2,830 to 3,400 THB.
The spec sheet total is accidentally close to the measured total in this case, which is why most growers never question it. The problem is not the monthly sum. It is that the spec sheet model misattributes cost to the pump and underattributes it to the light, which means any optimisation decision based on that model targets the wrong component first.
Measured actual draw (Plant Mood energy monitor data, 2024)
Pump at 18W continuous: 13 kWh per month, 45 to 55 THB. Grow light at 55W for 18 hours daily: 29.7 kWh per month, 104 to 125 THB. Fan at 21W continuous: 15.1 kWh per month, 53 to 63 THB. Total: 57.8 kWh per month, approximately 202 to 243 THB. Annual projection without seasonal cooling: approximately 2,425 to 2,920 THB.
The measured model produces a different optimisation sequence. Light schedule adjustment is the highest-return change available. Pump replacement or duty cycling is low-impact. Fan management matters more than most growers realise. And any cost model that excludes seasonal cooling underestimates annual running cost for growers without year-round air conditioning in the grow space.
Measured actual draw including hot season cooling (March to May)
Add a small 45W desktop cooler or supplemental fan running 10 to 14 hours per day during the 3 hottest months to manage reservoir temperature. Additional consumption: approximately 5 to 8 kWh per month for those 3 months, adding 18 to 34 THB per month, or 53 to 100 THB across the hot season. Annual electricity cost with cooling: approximately 2,480 to 3,020 THB.
Hot season cooling adds 2 to 3 percent to annual electricity cost. It is not expensive in absolute terms. But if the cooling is insufficient and hot season yield drops 30 to 36 percent, the electricity cost per gram of harvest climbs from 1.8 THB to 3.1 THB, making cool season and hot season fundamentally different economic propositions from the same hardware.
What the cost tracking showed across full cycles
Across 8 tracked lettuce cycles in 2023 to 2024, 4 cool season and 4 hot season, electricity cost per gram of harvested fresh weight averaged 1.8 THB in cool season and 3.1 THB in hot season. The electricity consumption per cycle was nearly identical across seasons. The yield was not. Cool season average harvest per cycle was approximately 1,840g of fresh weight across the tower. Hot season average was approximately 1,070g. The meter does not care about the season. The harvest does.
Cost per gram of harvest varied more between seasons than between any equipment configuration changes
If you are calculating tower economics using only electricity cost per month, you are missing the variable that changes most. Monthly running cost is stable. Yield per cycle is not. Cost per gram is the metric that captures both, and it makes the seasonal gap impossible to ignore.
Three back-to-back cycles were run in cool season conditions with identical nutrient formula, seed lot, and tower configuration. One cycle used 18/6 lighting, two used 16/8. Harvest fresh weight across the three cycles varied by less than 4 percent, within normal cycle-to-cycle variance. Light electricity consumption dropped from 29.7 kWh to 26.4 kWh per month. Over a 26-day cycle, the saving was approximately 9 THB per cycle, or approximately 126 THB per year at 14 cycles annually.
Switching from 18/6 to 16/8 light cycle reduced light electricity cost by 11 percent with no statistically detectable yield reduction across 3 comparison cycles
The 16/8 finding is not large in absolute terms but it is effectively free yield-neutral savings available to any tower operator. The reason most growers have not made this change is that grow guides written for commercial operations recommend 18 hours of light for maximum biomass, and that recommendation gets applied uncritically to apartment towers where the economics are entirely different.
The monitor cost 350 THB at a Bangkok electronics market. In the first month of use, it corrected a pump electricity overestimate of approximately 120 THB per month in the cost model and identified that the grow light was drawing more than budgeted by approximately 75 THB per month annually extrapolated. Net model correction in month one: approximately 45 THB per month in previously untracked light overcost identified. The monitor was financially net-positive within 8 months and has been running continuously since.
The energy monitor paid for itself in corrected cost model accuracy within the first month
Every small hydroponic operation in Bangkok running any kind of cost tracking should have a plug-in energy monitor on the main tower circuit. The cost is trivial relative to the model accuracy it provides. Electricity estimates from spec sheets are not a reasonable substitute for measured data in any operation where unit economics matter.
MEA charges progressive rates where consumption above 150 kWh per month per account moves into higher rate tiers. A hydroponic tower adding 58 to 68 kWh per month to a household that is already consuming 120 to 140 kWh from normal appliances may push the total household consumption into a higher rate tier for some months, meaning the marginal cost of the tower electricity is higher than the average household rate. In practice, this effect adds approximately 15 to 30 THB per month to actual tower cost for households in the 120 to 180 kWh baseline consumption range, an effect that no standard hydroponic electricity estimate accounts for.
MEA progressive rate structure means electricity cost is not linear with consumption at the household level
The real cost of tower electricity in Bangkok depends on what else is running in the same household. Growers who share an apartment with significant other electrical loads should calculate marginal cost at their actual consumption tier, not average cost. For PEA customers outside Bangkok, rate structures differ and the calculation changes again.
Plant Mood energy monitor data and grow log data, 2023 to 2024
What growers get wrong about tower electricity costs
My electricity bill went up more than I expected after I started running the tower and I cannot figure out where the extra cost is coming from.
The most common unaccounted source is the interaction between the tower load and the household progressive rate tier. If a grower estimates tower cost in isolation at the base MEA rate and does not account for the fact that tower consumption pushes the household total into a higher tier, the actual bill increase can be 20 to 40 percent larger than the estimate. The second most common source is the grow light drawing more than its rated wattage, which is measurable and almost never checked. Neither issue is visible without an energy monitor on the tower circuit and awareness of the household's baseline consumption level.
I read that hydroponic towers are cheap to run but my numbers do not match what people quote online.
The numbers quoted online almost always come from spec sheet wattage applied to the cheapest available electricity rate in the country of the writer. They rarely use MEA progressive rates, rarely use measured draw instead of rated wattage, and never account for Bangkok-specific additions like supplemental cooling in hot season. A figure written for a US grower on a flat-rate 0.12 USD per kWh tariff is not a useful input for a Bangkok MEA residential account. The calculation needs to be done from scratch with measured wattage and the actual rate tier the household sits in.
The pump is the part I worry about most for electricity because it runs all the time, but I am not sure how much it is actually costing.
The worry is misplaced and comes from the visibility of continuous operation rather than actual wattage. A pump running 24/7 at 18W real-load draw consumes 13 kWh per month. At MEA rates, that is 45 to 55 THB. Less than a single day of air conditioning. The grow light on an 18/6 cycle costs two and a half to three times as much per month. The pump is the easiest component to account for precisely because it runs at constant load continuously. The light is the harder one to get right because rated wattage, actual draw, and hours per day all have to be correct simultaneously.
How to build a cost model that reflects what the meter actually shows
Any grower running a tower with no energy monitor
Buy a plug-in energy monitor and run it on the tower circuit for one full week before building or revising any cost model. Record pump draw, light draw during active hours, and fan draw separately if possible by measuring each device individually for 24 hours before connecting all three. Note actual wattage, not rated wattage.
You will find at least one device drawing meaningfully differently from its spec sheet. In most setups, the pump draws less than rated and the light draws more. The week of measurement replaces months of model error.
Growers calculating monthly tower electricity cost
Calculate at the marginal MEA rate tier your household actually sits in, not the base rate. Check last month's bill for total household consumption. If total consumption including the tower exceeds 150 kWh, apply the correct progressive rate for the excess. If your household baseline is already above 150 kWh before adding the tower, every kWh of tower electricity costs at the higher tier rate.
Monthly electricity cost estimate that is within 10 to 15 percent of actual bill impact, compared to a spec-sheet-at-base-rate estimate that can be 30 to 50 percent off in either direction.
Growers optimising electricity cost
Adjust light schedule to 16/8 from 18/6 and run three consecutive cycles to check for yield impact with your specific variety and tower. If yield variance across those cycles is within normal range (less than 8 percent cycle-to-cycle), adopt 16/8 permanently. Do not adjust pump schedule unless your tower design allows intermittent circulation without root zone desiccation risk.
Approximately 11 percent reduction in grow light electricity cost with no yield reduction in most leafy green varieties. Annual saving of 100 to 150 THB per tower. Small in isolation. Meaningful compounded across a multi-tower operation or recalculated as yield-neutral cost reduction per gram.
Growers building a cost-per-gram model for unit economics
Track electricity cost per cycle, not per month. Divide total cycle electricity consumption (cycle length in days multiplied by daily draw in kWh) by harvest fresh weight in grams. Log this figure for every cycle alongside season. After 6 cycles, the seasonal cost-per-gram divergence will be visible and will reframe how you think about hot season economics relative to cool season.
A cost model where seasonal yield variation is expressed in per-gram electricity cost rather than aggregate monthly spend. This makes the hot season yield problem financially visible in a way that monthly electricity totals do not, and creates a clear economic argument for reservoir temperature management that the aggregate numbers obscure.
Growers adding supplemental cooling in hot season
Measure the actual wattage of any cooling device before committing to it as part of the hot season setup. A device that reduces reservoir temperature by 3 to 4 degrees Celsius and runs 10 hours per day costs a calculable amount per month. Divide that monthly cost by the expected yield improvement it produces, expressed in grams. If the cost per gram recovered is lower than the current hot season cost per gram, the cooling device improves unit economics. If it is higher, it does not.
A cooling decision made on measured numbers rather than general preference for better crops. In Plant Mood data, a 45W supplemental cooling device running 12 hours per day in hot season added approximately 20 to 25 THB per month and recovered yield sufficient to reduce hot season cost per gram from 3.1 THB to approximately 2.3 THB, making it economically justified at any sale price above production cost.
Step 2, the marginal rate calculation. Most growers apply the lowest MEA rate to all tower consumption because it is the number that appears first on explanations of Thai electricity pricing. The progressive rate structure means this underestimates electricity cost for any household with moderate baseline consumption, and it systematically makes tower economics look better than they are in the cost model.
FAQ
How much does it cost to run a hydroponic tower in Bangkok per month?
Based on Plant Mood measured energy monitor data in 2024, a single tower running a pump, grow light on 18/6 cycle, and a 6-inch fan continuously draws approximately 94W average and consumes 57 to 68 kWh per month. At MEA progressive residential rates, the monthly electricity cost is approximately 202 to 285 THB depending on the rate tier the household sits in. Spec sheet estimates tend to run 15 to 30 percent higher because pump wattage is overestimated from rated figures.
Is the pump or the grow light the biggest electricity cost in a hydroponic tower?
The grow light. In Plant Mood measured data, the grow light accounted for 58 percent of total tower electricity draw despite running on an 18/6 cycle rather than continuously. The pump drew 18W real-load versus 25W rated, costing approximately 45 to 55 THB per month. The grow light cost approximately 104 to 125 THB per month. The pump is the component most growers identify as their primary electricity concern. The meter consistently disagrees.
How do I calculate hydroponic electricity cost using Bangkok MEA rates?
Measure actual device wattage with a plug-in energy monitor rather than using spec sheet ratings. Multiply measured watts by daily operating hours to get daily kWh, then by 30 for monthly consumption. Apply MEA progressive rates at the tier your total household consumption reaches, not the base rate. If your household already consumes above 150 kWh per month before adding the tower, every kWh of tower electricity is billed at the higher progressive tier, adding 15 to 30 THB per month that flat-rate estimates miss.
Does changing the light schedule from 18/6 to 16/8 save meaningful electricity in a hydroponic tower?
It saves approximately 11 percent of grow light electricity cost with no detectable yield reduction in leafy greens across 3 comparison cycles in Plant Mood data. Monthly saving is approximately 11 to 14 THB per tower. Annually, approximately 130 to 165 THB. The saving is yield-neutral and requires only a timer adjustment, making it the highest-return low-effort optimisation available for tower electricity cost.
Why is my actual electricity bill higher than my hydroponic tower estimate?
The two most common causes are the MEA progressive rate tier effect and grow light draw exceeding rated wattage. If tower consumption pushes your household total into a higher MEA tier, the marginal cost of tower electricity is higher than the base rate estimate. Grow lights frequently draw 5 to 15 percent more than their marketed panel wattage due to driver losses. A plug-in energy monitor on the tower circuit identifies both discrepancies within one week.
What is the electricity cost per gram of hydroponic lettuce in Bangkok?
In Plant Mood tracked cycles from 2023 to 2024, electricity cost per gram of harvested fresh weight averaged 1.8 THB in cool season (November to February) and 3.1 THB in hot season (March to May). The monthly electricity draw was nearly identical across seasons. The yield was not: cool season averaged approximately 1,840g per cycle, hot season approximately 1,070g. The meter runs at the same rate year-round. The harvest does not.
Does running a fan 24/7 for a hydroponic tower cost more than the pump?
Yes, marginally. In Plant Mood measured data, a 6-inch clip fan rated at 20W drew 21W actual and consumed approximately 15.1 kWh per month, costing 53 to 63 THB. The pump consumed approximately 13 kWh per month at 18W real-load draw, costing 45 to 55 THB. Fan cost exceeded pump cost by approximately 15 to 20 percent monthly. Most hydroponic electricity cost guides do not include fan draw in their tower running cost estimates.