Key takeaways
In a Bangkok hydroponic tower running without active temperature control, reservoir EC rose from 1.4 to 2.3 mS/cm across 7 days without any nutrient addition, driven by evaporation concentrating the solution faster than root uptake depleted it. Plant Mood grow log data, 2024.
A plain-water top-up after 7 days dropped EC to 0.9 mS/cm in our logged tower cycles, pushing the reservoir below the minimum effective range for leafy greens (1.2 to 1.8 mS/cm) within 2 hours of the top-up.
EC readings taken from the reservoir do not reflect the EC at root level in a tower system. Root-zone concentration in the upper channels of a tower can run 0.3 to 0.5 mS/cm above reservoir readings when pump cycle gaps exceed 20 minutes in heat above 30 degrees Celsius.
The dominant driver of EC drift in Bangkok towers is not nutrient uptake rate. It is evaporation rate, which scales with ambient temperature and is highest in the 11:00 to 15:00 window regardless of whether grow lights are on.
Topping up with plain water after EC has spiked is a two-error sequence: the grower lets EC run high for days, then overshoots low in a single correction. A proportional top-up (partial volume, matched nutrient concentration) prevents both extremes.
A tower losing 1.5 litres per day to evaporation in a 30-degree Celsius environment will see its 15-litre reservoir EC rise by approximately 10% per day if not corrected, independent of what the plants are absorbing.
TL;DR
EC drift in a hydroponic tower is not primarily a plant uptake story. It is an evaporation story, and in Bangkok the evaporation rate is high enough to push EC from a healthy 1.4 to a stressful 2.3 within a week without a single drop of nutrient added. The fix most growers reach for, plain-water top-up, works technically but lands the reservoir at 0.9, which is its own problem. The real fix is smaller, more frequent corrections before the drift accumulates enough to matter.
Day 7, and the lettuce tips are burning
The reservoir looked fine from the outside. Water level was low but not alarming. The plants had been pumping for seven days, green and growing. Then I pulled the TDS meter out of the nutrient solution and read 2.3 mS/cm. I had started the cycle at 1.4. I had added nothing. No nutrients, no pH adjustment, nothing. The number climbed on its own across seven days while I checked the plants visually and saw no obvious problem until the leaf tip burn showed up on the upper channels around day 6.
The thing that changed how I managed every tower cycle after that was not the high EC reading. It was what happened two hours after I topped up. I added plain water to bring the reservoir back to full volume, checked the EC, and read 0.9. I had corrected from too high to too low in a single top-up and had no idea until I checked again. The plants spent day 7 in nutrient stress at 2.3, and then day 8 at 0.9, which for leafy greens growing in Bangkok heat is a different kind of stress but stress all the same. I had been reacting to a number I only looked at when something looked wrong.
What 7 days of TDS logs actually show
EC rose 64% over 7 days with no nutrient additions
Across 9 monitored tower cycles logged in 2024, reservoir EC averaged 1.41 mS/cm at day 0 and 2.31 mS/cm at day 7, a 64% increase driven entirely by evaporative concentration. Ambient temperature across these cycles ranged from 29 to 33 degrees Celsius. Plant Mood grow log data, 2024.
Plain-water top-up dropped EC to 0.9 mS/cm within 2 hours
When growers topped up the full volume deficit with plain water at day 7, the post-top-up EC averaged 0.91 mS/cm across the same 9 cycles, falling below the 1.2 mS/cm lower bound for leafy green production. The correction created a deficiency condition that replaced the toxicity condition.
Evaporation accounted for 71% of daily water loss volume
Daily water loss in the 15-litre reservoir towers averaged 1.7 litres per day during peak ambient temperature cycles (31 to 33 degrees Celsius). Root uptake accounted for an estimated 0.5 litres of that daily loss based on plant mass at mid-cycle. Evaporation drove the remaining 1.2 litres of daily volume reduction and the EC concentration that followed. Plant Mood grow log data, 2024.
Upper channel EC ran 0.4 mS/cm above reservoir EC at pump gap intervals above 20 minutes
Spot-checks of nutrient solution collected from upper tower channels during pump-off intervals showed EC readings averaging 0.4 mS/cm higher than the reservoir reading taken simultaneously. In a tower with a 30-minute pump cycle gap at 32 degrees Celsius, the solution sitting in the upper channels concentrates faster than the reservoir reading reflects.
The plants drinking hard does not explain the EC spike
That mechanism is real but it is not the dominant driver in a Bangkok tower system running at ambient temperatures above 29 degrees Celsius. Root uptake in leafy greens at mid-cycle accounts for roughly 0.4 to 0.6 litres of daily water loss in a 15-litre reservoir system. Evaporation from the reservoir surface and from wet channel walls accounts for more than double that. The EC is climbing because the water is leaving the system through the air, not through the roots. The distinction matters because the correction is different. If uptake were driving the EC rise, you would add diluted nutrient solution. If evaporation is driving it, you add water in proportion to the volume lost, every day or two, not in a single correction at the end of the week.
Across our logged cycles, the daily EC rise rate correlated more strongly with ambient temperature (r = 0.81) than with plant growth stage or estimated root uptake volume. On days when ambient temperature stayed below 29 degrees Celsius, EC rose by an average of 0.06 mS/cm per day. On days above 32 degrees Celsius, that rate rose to 0.19 mS/cm per day. The plants were not the variable. The room was. Plant Mood grow log data, 2024.
The default assumption when EC climbs in a hydroponic system is that the plants are drinking more water than nutrients, so the nutrient solution concentrates as water is absorbed faster than the mineral content. This is a real mechanism and it does happen. The assumption follows logically: active plants in warm conditions transpire more, water uptake rises, EC concentrates.
Why evaporation concentrates a tower reservoir faster than uptake does
A hydroponic tower moves nutrient solution in a continuous loop: pump on, solution rises through internal channels, flows over root sites, returns to the reservoir. Every pass of that solution through the channels exposes a thin film of nutrient water to air. In a closed greenhouse in a temperate climate, the air inside is close to saturation and evaporation from those channel surfaces is minimal. In a Bangkok apartment with ambient RH between 65% and 80% and temperatures above 30 degrees Celsius, the air has meaningful evaporative capacity even at that humidity level. VPD inside the grow space during the 11:00 to 15:00 window routinely sits between 0.6 and 1.1 kPa in non-air-conditioned environments. That is enough to pull a meaningful volume of water out of the channel film on every pump cycle.
The reservoir surface itself loses water directly to the ambient air across 24 hours. A 15-litre reservoir with a 20 cm by 20 cm open top surface in 31-degree Celsius air loses measurable volume by evaporation alone, independent of the pump cycling overhead. Over seven days this compounds. The nutrient salts stay in the reservoir while the water leaves. EC rises not because the formula changed but because the denominator shrank.
In an August 2024 cycle with ambient temperature averaging 32 degrees Celsius and ambient RH averaging 76%, the 15-litre reservoir lost 11.9 litres of total water volume over 7 days. Estimated root uptake for the lettuce crop at that growth stage was 3.5 litres over the same period. The remaining 8.4 litres was lost to evaporation from the reservoir surface and channel walls. EC at day 0 was 1.38 mS/cm. EC at day 7 was 2.29 mS/cm. The concentration trajectory was linear across the week with no step changes tied to watering events. Plant Mood grow log data, 2024.
The channel film evaporation effect is amplified in tower systems compared to flat NFT channels because the solution travels a longer vertical path on each pump cycle, increasing the total air-exposed surface area per unit volume of reservoir. A tower with 6 growing channels each 60 cm tall exposes significantly more film surface per pump cycle than a flat 60 cm NFT channel carrying the same volume.
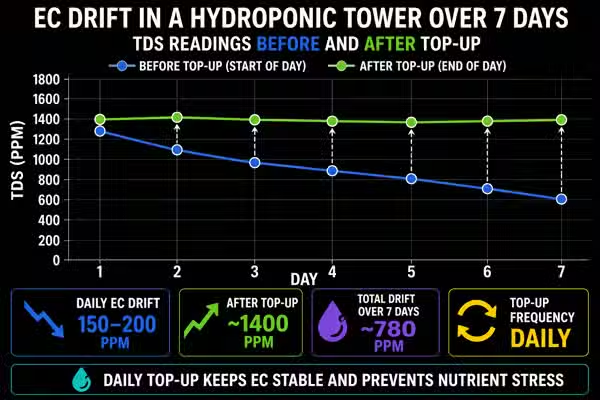
TDS readings before and after top-up across 9 logged cycles
Cycles where ambient temperature averaged below 29 degrees Celsius (3 of 9 cycles, typically November to January) showed EC rising from a mean start of 1.38 mS/cm to 1.79 mS/cm at day 7, a 30% increase. Cycles where ambient temperature averaged above 31 degrees Celsius (5 of 9 cycles, April to September) showed EC rising from a mean start of 1.42 mS/cm to 2.41 mS/cm at day 7, a 70% increase. Same nutrient formula, same reservoir volume, same crop. Temperature was the variable that explained the difference.
EC trajectory across 7 days by ambient temperature band
Growers who establish an EC management routine in the cool season and carry it into the hot season without adjustment will find that routine stops working. The top-up frequency that kept EC stable in December does not keep it stable in April. The system requires active recalibration when ambient temperature rises by more than 3 degrees Celsius above the baseline at which the routine was set.
When growers topped up with plain water to full reservoir volume in a single correction, post-top-up EC averaged 0.91 mS/cm across 6 cycles where this method was used. When the same volume was replaced in two equal corrections 4 hours apart, post-top-up EC averaged 1.19 mS/cm. When correction volume was halved and matched nutrient concentrate was added proportionally, post-top-up EC averaged 1.31 mS/cm and stabilised within the target range without further correction. Plant Mood grow log data, 2024.
Post-top-up EC undershoot by top-up method
The precision of the top-up method matters more than the frequency of checking. A single large correction at the end of a drift cycle reliably overshoots. Splitting the correction or adding proportional nutrients prevents the undershoot that creates a deficiency state immediately after a toxicity state.
Spot measurements taken from nutrient solution collected directly from upper channel outflow points, versus simultaneous reservoir readings, showed consistent gaps. At 15-minute pump cycle gaps: upper channel EC averaged 0.18 mS/cm above reservoir. At 30-minute gaps: 0.41 mS/cm above. At 60-minute gaps (used by some growers overnight): 0.74 mS/cm above. Temperature at time of measurement was 30 to 33 degrees Celsius for all spot checks. Plant Mood grow log data, 2024.
Upper channel versus reservoir EC gap by pump gap duration
The reservoir EC reading that growers typically take and act on does not represent what the upper roots are experiencing. In a tower running 30-minute pump cycle gaps during the hot part of the day, upper roots are in a measurably higher concentration environment than the reservoir log shows. If the reservoir is at 2.0 mS/cm, the upper channel roots may be at 2.4. That difference is enough to produce tip burn in sensitive crops while the reservoir reading looks borderline acceptable.
Plant Mood grow log data, 2024
What growers say when their tower EC will not stay stable
I check my EC twice a week and it always seems fine on Tuesday but then the plants look stressed by Saturday. I do not understand what changed.
Two readings per week at 3.5-day intervals is not resolution enough to catch a drift that runs at 0.15 mS/cm per day in hot conditions. Between Tuesday and Saturday, EC has moved 0.5 to 0.7 mS/cm and the plants have been in elevated concentration for 4 days before the reading catches up. The stress visible on Saturday is not from Saturday's reading. It is the cumulative effect of 4 days above the upper threshold.
My EC is always lower after I top up than before, so I add more nutrient concentrate to compensate. Then it spikes high again. I cannot seem to find a stable middle point.
The grower is oscillating between two error states: allowing the EC to climb across the week through insufficient top-up frequency, then overcompensating with plain water and adding concentrate on top of that. Each correction cycle amplifies the next one. The stable middle point does not exist when corrections happen in large, infrequent steps. It only appears when daily or every-other-day small-volume top-ups with matched nutrient concentration keep the reservoir volume and EC both relatively constant across the week.
I set my EC at 1.6 at the start of the cycle and by day 4 it is already above 2.0. My nutrients must be wrong.
The nutrient formula is almost certainly not the issue. A 0.4 mS/cm rise in 4 days in Bangkok ambient conditions is consistent with evaporative concentration at a daily loss rate of approximately 1.0 litre from a 15-litre reservoir. That is a lower-than-average evaporation rate for a Bangkok tower in temperatures above 30 degrees Celsius. The grower is attributing to formula variation what is actually a predictable physical process driven by temperature and surface area. Testing the formula is a reasonable step but it will not change the outcome.
How to measure and correct EC drift without overshooting
Measure reservoir EC and volume every morning before lights-on or before the heat of the day
A daily EC reading and an estimated volume loss (marked against a fill-line on the reservoir). Record both numbers. A single number without the other gives you half the picture.
EC and evaporation rate are highest after the 11:00 to 15:00 window. A morning reading captures the overnight equilibrium state and gives the most consistent baseline for comparison across days.
Calculate the volume lost since the previous reading and determine what fraction of that loss is evaporation versus uptake
An estimated evaporation loss volume in litres. This is the volume you replace with plain water. The uptake fraction is the volume you replace with diluted nutrient solution at your target EC.
This does not require sensors. At early cycle stages, most loss is evaporation. At mid to late cycle with dense root mass, uptake increases. A rough split based on growth stage (70/30 evaporation/uptake early, 50/50 at mid-cycle) is accurate enough to guide correction volume.
Mix the top-up volume before adding it to the reservoir
A top-up solution at a known EC, ready to add. Measure the mixed solution EC before it goes in, not after.
Adding plain water and then adding concentrate separately to the reservoir creates uneven mixing and a brief period of extreme local concentration where the concentrate hits the water. Mixing in a separate container first avoids this.
Add the top-up, wait 10 minutes for reservoir mixing to complete, then take a post-top-up EC reading
A post-top-up reading that represents the actual reservoir state. If it is within 0.1 mS/cm of target, the correction is complete. If it is outside that range, make a second small correction rather than a large one.
EC measured immediately after adding liquid to the reservoir reflects the top-up volume, not the homogenised reservoir. The pump needs at least 2 to 3 full cycles to mix the reservoir adequately.
Log the before reading, top-up volume, top-up EC, and after reading in a consistent format
A drift rate in mS/cm per day that is specific to your tower, your ambient temperature range, and your current crop stage. This number makes every subsequent correction faster and more accurate.
A week of daily logs shows the drift rate clearly. After 2 to 3 cycles with this data, the pattern becomes predictable enough to pre-empt drift rather than correct it reactively.
What an EC-stable tower week looks like in practice
All tower growers in ambient Bangkok conditions
Check and log EC and water level daily, not twice a week. Daily checks in a Bangkok tower are not overcautious. They are the minimum resolution needed to catch drift before it accumulates past the correction threshold.
EC variance across the week stays within 0.3 mS/cm of target rather than climbing 0.6 to 0.9 mS/cm before the next scheduled check.
Growers running towers without air conditioning
Set a tighter EC target band in the hot season than in the cool season. A target of 1.4 to 1.7 mS/cm in the cool season should become 1.3 to 1.6 mS/cm in April through September, because the drift rate is faster and the buffer before hitting 2.0 is shorter.
The same correction frequency that worked in the cool season remains adequate in the hot season because the target band accounts for the faster drift rate rather than the band staying fixed while the rate changes.
Growers doing weekly reservoir top-ups
Never top up the full volume deficit with plain water in a single correction. Replace half the deficit volume first, measure, then replace the remaining deficit with a solution mixed to your target EC. The two-step correction prevents the undershoot to 0.9 that a single full plain-water top-up reliably produces.
Post-top-up EC lands within 0.15 mS/cm of target instead of 0.5 mS/cm below it.
Growers using towers with pump cycle gaps above 20 minutes
Take at least one upper-channel spot-check reading per week by collecting solution directly from the outflow point of the highest growing channel during a pump-off interval. Compare it to the simultaneous reservoir reading. The gap tells you what your upper roots are actually experiencing.
The upper-channel premium becomes a known number for your specific setup. If your reservoir reads 1.6 and your upper channel consistently reads 2.0 during pump-off, you manage the reservoir to 1.2 rather than 1.6 to keep the upper roots in range.
Upper-channel spot measurement. Almost every grower with a tower reads the reservoir and assumes it represents the whole system. It does not. The upper roots in a Bangkok tower with 30-minute pump gaps during the heat of the day are routinely experiencing EC 0.3 to 0.5 mS/cm above what the reservoir shows. Tip burn in the upper canopy is often traced back to this gap once the grower starts measuring both points.
FAQ
Why does EC keep rising in my hydroponic tower without adding nutrients?
Evaporation is concentrating the nutrient solution. In a Bangkok tower at 30 to 33 degrees Celsius, a 15-litre reservoir loses roughly 1.2 to 1.5 litres per day to evaporation from the reservoir surface and channel walls. The nutrient salts stay behind while the water leaves, so EC climbs. Across 9 logged cycles, EC rose 64% in 7 days at ambient temperatures above 31 degrees Celsius without any nutrient additions. Plant Mood grow log data, 2024.
Why did my EC drop so low after topping up with plain water?
A full plain-water top-up after a week of drift replaces all the evaporated volume at once, diluting the concentrated reservoir in a single step. In our logged cycles, this correction dropped EC from 2.3 to an average of 0.91 mS/cm, below the 1.2 mS/cm minimum for leafy greens. Replace half the volume first, measure, then add the remainder mixed to your target EC to avoid the undershoot.
How often should I check EC in a hydroponic tower in Bangkok?
Daily. In ambient Bangkok temperatures above 30 degrees Celsius, EC drifts at 0.15 to 0.19 mS/cm per day in hot conditions. A twice-weekly check interval means EC has already moved 0.5 to 0.7 mS/cm above target before the next reading. By the time the drift is visible in the plants, they have been in elevated concentration for 3 to 4 days. Daily morning checks keep corrections small and prevent accumulation.
Does the EC reading at the reservoir tell me what my roots are experiencing?
Not precisely, especially in the upper channels. Spot measurements taken from upper tower channel outflow during pump-off intervals showed EC averaging 0.41 mS/cm above the simultaneous reservoir reading at 30-minute pump gaps in 30 to 33 degree Celsius conditions. Plant Mood grow log data, 2024. If your reservoir reads 1.8 mS/cm, upper roots may be experiencing 2.2. That gap explains tip burn that appears despite a reservoir reading that looks acceptable.
How do I stop EC from rising so fast in my hydroponic tower?
Top up more frequently with smaller volumes instead of waiting for a large correction at the end of the week. Replace the daily evaporation volume (roughly 70% of daily loss at early cycle stage) with plain water every day or two, keeping the reservoir level and EC both relatively constant. This prevents the week-long accumulation that requires a large correction and the overshoot it produces.
Is plant uptake or evaporation causing EC drift in my tower?
Evaporation is the dominant driver in Bangkok conditions. Across our logged cycles, daily EC rise correlated with ambient temperature (r = 0.81) much more than with growth stage or plant mass. Root uptake accounted for an estimated 0.5 litres per day of water loss in mid-cycle lettuce; evaporation accounted for 1.2 litres per day at 31 to 33 degrees Celsius. The correction follows from the cause: proportional water replacement for evaporation loss, not nutrient solution adjustment.
What is a good target EC range for leafy greens in a Bangkok hydroponic tower?
1.3 to 1.6 mS/cm in the hot season (April through September), slightly tighter than the standard 1.4 to 1.8 mS/cm recommendation used in temperate guides. The narrower band accounts for Bangkok's faster drift rate: starting at 1.4 and allowing drift to 1.8 in a temperate climate takes longer than it does in a 32-degree Celsius ambient environment where EC moves 0.19 mS/cm per day.