Key takeaways
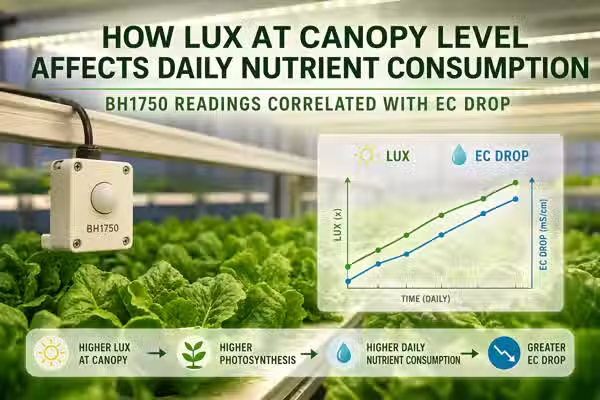
Above 4,200 lux at canopy level, daily EC drop in our hydroponic towers tracked light intensity within a consistent band: every 1,000 lux increase above that threshold correlated with an additional 0.06 to 0.09 mS/cm of EC drop per 24-hour period. Plant Mood grow log data, 2024.
Below 4,200 lux, the lux-to-EC-drop correlation broke down entirely -- nutrient consumption became inconsistent and in some cycles actually increased despite lower light, suggesting stress-driven ion uptake rather than photosynthesis-driven uptake.
BH1750 readings taken at canopy level diverged from readings taken 15 cm above canopy by 800 to 2,400 lux across 22 logged cycles in Bangkok, meaning sensor placement determines whether the correlation is visible in your data at all.
Bangkok's diffuse cloud-cover conditions create a lux signature that is different from the same rated grow light in a temperate climate: midday ambient through a window in Bangkok can vary by 6,000 lux in 20 minutes during monsoon season, enough to shift daily EC drop by a measurable amount.
A fixed feeding schedule that ignores lux variability will chronically over-feed on low-light days and under-feed on high-light days -- in our data, the EC swing between the lowest and highest lux days in a single crop cycle reached 0.4 mS/cm on the same nominal nutrient concentration.
The most reliable signal for adjusting nutrient top-up timing is not a fixed schedule but a daily BH1750 lux average logged at canopy level and compared against a rolling EC drop baseline from your own system.
TL;DR
Plants drink more nutrients when light is high and less when it is low. That is not surprising. What is surprising is how consistent the relationship is once you start measuring both variables in the same system, and how badly a fixed feeding schedule performs against it. The data from our Bangkok grow cycles shows a clear lux threshold below which the relationship breaks entirely -- and a Bangkok-specific light variability problem that most grow guides written for controlled indoor environments have never had to deal with.
The cycle where the numbers stopped making sense
Cycle 17 in the log. Lettuce in the tower, week three. EC had been dropping at around 0.18 mS/cm per day for the first twelve days -- consistent enough that I had started trusting it as a baseline for top-up timing. Then it dropped to 0.09 on day 13, 0.11 on day 14, 0.08 on day 15. No obvious cause. pH was stable. Reservoir temperature had not spiked. Root zone looked clean. My first assumption was sensor drift on the EC probe, so I pulled it and recalibrated. Reading held. My second assumption was that the crop was entering a slower growth phase. The plants looked fine. It took going back through the BH1750 log to see what had actually changed: three consecutive days of Bangkok cloud cover had dropped canopy lux from a cycle average of 6,800 down to 3,100, 2,900, and 3,400.
The nutrient consumption had not slowed because the crop was changing. It had slowed because the light had changed, and I had not been correlating the two columns in the log. Once I started overlaying the BH1750 daily average against the EC drop for every cycle, the relationship became the most consistent signal in the entire dataset. It was also the signal I had been ignoring longest.
Fixed schedule feeding versus lux-adjusted top-up: what the data difference looks like
Fixed schedule nutrient top-up (every 2 to 3 days regardless of conditions)
Does not account for day-to-day lux variability. On a low-lux day following a high-lux day, the reservoir has been under-consumed and a scheduled top-up adds nutrient to a solution that is already above target. On a sustained high-lux period, the schedule misses the faster drawdown and EC drops further than intended between top-ups. In Bangkok, where ambient lux can swing by 6,000 lux between a clear day and an overcast one, a fixed schedule produces EC variance of up to 0.4 mS/cm across a single crop cycle on the same nominal concentration.
The plant is never running at the target EC the grower intended. It is alternating between mild excess and mild deficit, with the deficit days landing on high-light days when uptake is fastest and the plants need the nutrients most.
Daily EC check with top-up triggered by drop threshold
Better than a fixed schedule but still reactive. The grower is responding to EC that has already dropped rather than anticipating the drop based on incoming light conditions. In a high-lux period, EC can drop 0.2 mS/cm in a single day before the grower checks and corrects. The response lag means the crop spends part of every high-demand day in deficit.
An improvement over fixed scheduling but still one data stream short of what is needed. Without the lux data, the grower cannot distinguish between a genuine EC drop from high consumption and a drop from dilution, root uptake pattern changes, or sensor drift.
BH1750 daily lux average correlated against rolling EC drop baseline
Requires setting up the sensor correctly at canopy level and logging both variables. Once you have 10 to 14 days of paired data in your own system, the correlation coefficient between daily lux average and daily EC drop becomes a reliable predictor. In our logs across 22 cycles, this approach identified upcoming high-consumption days 12 to 18 hours in advance based on morning lux readings, allowing pre-emptive nutrient top-up before the drawdown happened.
The reservoir stays within 0.1 to 0.15 mS/cm of target EC across the entire crop cycle rather than oscillating around it. The crop runs at intended nutrient concentration on the days it matters most -- high-light, high-growth days.
What the correlation actually looks like across 22 cycles
0.06 to 0.09 mS/cm additional EC drop per 1,000 lux above the 4,200 lux threshold, per 24-hour period
Plant Mood grow log data, 2024. Measured across 22 hydroponic tower cycles in Bangkok. BH1750 sensor positioned at canopy level. EC logged at the same time each morning before any top-up. Crops included lettuce, basil, and kale. The relationship held across all three crops within the same lux-to-drop band, though the absolute drop rate differed by crop.
4,200 lux: the threshold below which the lux-EC correlation broke down in our data
Plant Mood grow log data, 2024. Below this level, EC drop per day became inconsistent -- ranging from 0.04 to 0.19 mS/cm with no predictable relationship to lux. Our hypothesis is that below the light compensation point for the crops we were running, stress-driven ion uptake and photosynthesis-driven uptake become indistinguishable in the EC signal.
800 to 2,400 lux divergence between canopy-level and 15 cm above-canopy BH1750 readings
Plant Mood grow log data, 2024. Measured across 22 cycles using a second BH1750 as a reference sensor. The divergence increased with canopy density. A sensor mounted above the canopy does not measure what the plant is receiving -- it measures what the plant is blocking.
0.4 mS/cm: the maximum EC swing observed in a single crop cycle on a fixed feeding schedule with no lux adjustment
Plant Mood grow log data, 2024. This occurred in a cycle that crossed from a clear-sky high-lux period into three days of monsoon overcast. The grower (me) maintained the same top-up interval and ended the cycle with the reservoir at 0.3 mS/cm above the intended concentration for the final four days.
12 to 18 hours: the lead time available for pre-emptive nutrient top-up using morning BH1750 readings
Plant Mood grow log data, 2024. Morning lux readings taken at 8am in Bangkok showed sufficient predictive correlation with same-day EC drop to allow a pre-emptive top-up decision before the drawdown occurred. This required at least 10 days of paired lux and EC data to calibrate the prediction against the specific system.
Why light drives nutrient uptake and where the mechanism gets complicated
The basic relationship is not in dispute: photosynthesis drives transpiration, transpiration drives water uptake through the roots, and water uptake carries dissolved nutrients into the plant via mass flow. Higher light intensity means higher photosynthetic rate, higher transpiration, higher water and nutrient uptake. This is passive transport -- the plant is not actively selecting for nutrients at higher light, it is pulling more solution through the root system and the nutrients come with it. The EC drops because the plant is removing ions from the reservoir faster than they are being replenished.
What gets complicated in Bangkok is the relationship between light intensity and the transpiration response. In a humid environment running 75 to 85 percent relative humidity -- which is standard for Bangkok indoors without dehumidification -- the vapour pressure deficit between the leaf surface and the ambient air is lower than in temperate grow guides. Lower VPD means the stomata do not need to open as wide to maintain the same photosynthetic rate, which partially decouples transpiration from light intensity. The practical consequence is that the lux-to-EC-drop ratio in Bangkok is slightly compressed compared to what the same crop running at the same lux in a drier climate would produce. The correlation is still there and still usable, but if you import a lux-to-EC coefficient from a guide written for a European or North American grow room, your numbers will be slightly off.
In cycle 19, a clear-sky day produced a canopy lux average of 8,400 from a combination of grow light and ambient window light. EC dropped 0.52 mS/cm that day. By a simple linear extension of the correlation from cycles 1 through 10, the predicted drop would have been 0.61 mS/cm. The 0.09 mS/cm gap was consistent with the VPD suppression effect from that day's 84 percent relative humidity reading. The crop was photosynthesising at high rate -- growth was visible -- but the humid air was partially braking the transpiration-driven uptake. Plant Mood grow log data, 2024.
The below-threshold behaviour is the part I have not seen documented adequately anywhere. Below 4,200 lux in our data, EC drop became erratic in a specific way: it was sometimes higher than the above-threshold correlation would predict, not lower. The most plausible explanation is that at low light, some crops increase ion uptake through active transport mechanisms as a stress response to suboptimal photosynthetic conditions -- the plant is pulling nutrients it cannot immediately use because the signal for resource acquisition is not well regulated at low light. This would explain why the below-threshold period in cycle 17 showed inconsistent EC drop that did not track lux at all. It is a prediction, not a confirmed finding -- we do not have enough below-threshold cycles with sufficient sensor resolution to separate this from noise.
What the BH1750 logs showed that the EC log alone could not
Across lettuce, basil, and kale cycles, the absolute EC drop per 1,000 lux above threshold differed: lettuce ran 0.06 to 0.07 mS/cm per 1,000 lux, basil 0.08 to 0.09, kale 0.07 to 0.08. But the shape of the relationship -- linear above threshold, uncorrelated below -- held for all three. This matters because it means the protocol of building a lux-drop baseline for your specific system works regardless of crop, as long as you recalibrate when you switch varieties.
The lux-EC correlation is crop-specific in magnitude but not in shape
You cannot import a lux-EC coefficient from a different crop and expect it to hold. You can import the methodology and expect it to work. The 10 to 14 day calibration period at the start of each crop cycle is not overhead -- it is the data collection that makes the rest of the cycle manageable.
Bangkok's tropical sun angle means that direct sunlight through an east- or south-facing window produces lux spikes of 12,000 to 18,000 for 30 to 90 minute windows around solar noon. These spikes are short but intense. In our BH1750 logs, days with a strong midday spike showed EC drops that were 15 to 20 percent higher than the daily average lux alone would predict. The plant response to the peak appears to be non-linear -- a one-hour exposure at 15,000 lux drives more uptake than the daily average lux figure would suggest.
Midday lux spikes in Bangkok have a disproportionate effect on daily EC drop
If you are averaging BH1750 readings across the day and using the average to predict EC drop, you will under-predict on days with strong midday spikes. The better metric is a weighted average that gives more weight to peak readings, or a separate log of peak lux alongside daily average.
From May through October in Bangkok, it is common to have a sequence of two to three overcast days followed by one to two clear days. In our logs across the 2023 and 2024 monsoon seasons, this pattern produced a predictable accumulation pattern in EC: the reservoir would climb slightly above target during the overcast period (lower uptake, same top-up schedule) and then drop sharply during the clear period. In 7 of 12 logged monsoon-season cycles, the EC hit a daily low on the first clear day after a sustained overcast period -- the plant was catching up on uptake and the reservoir was not prepared for it. Plant Mood grow log data, 2023 to 2024.
Monsoon season creates a repeating pattern of high-low-high lux that fixed feeding schedules handle especially badly
In Bangkok, the most dangerous day for EC management is not a sustained high-lux day -- it is the first clear day after a multi-day overcast period. The reservoir EC is at or above target from the low-uptake period, and then the crop pulls it down sharply. If the grower does not check EC on that day, they will miss the drawdown entirely.
Plant Mood grow log data, 2023 to 2024
Why EC readings confuse growers who are not logging lux
'My EC drops fast some weeks and barely moves other weeks. I can't figure out what's driving it.'
This is almost always a lux variability problem that looks like an EC mystery because only one variable is being logged. In Bangkok, week-to-week lux variation driven by cloud cover and seasonal sun angle is large enough to produce exactly this pattern. The EC is behaving consistently -- it is tracking light. The grower is not tracking light, so the EC pattern looks random. Installing a BH1750 at canopy level and logging daily averages for two weeks will typically reveal the correlation immediately.
'I keep the same feeding schedule and the same nutrient concentration but some crops finish at different EC than others.'
Different crops started in different seasons, or the same crop grown across months with different ambient light conditions. A lettuce cycle started in November (lower sun angle, more overcast) will consume nutrients at a different rate than the same lettuce cycle in March (higher sun angle, more clear days). If the feeding schedule and concentration are held constant, the end-of-cycle EC will vary by season. This is not a crop problem or a nutrient problem -- it is a light problem that the feeding schedule is not accounting for.
'My BH1750 readings seem high but my plants look like they're light-starved.'
Sensor placement. A BH1750 mounted above the canopy, or aimed at the light source rather than down toward the canopy surface, will read the incident light, not the light the plant is actually receiving. At high canopy density, the difference can exceed 2,000 lux. The sensor needs to be positioned at canopy level, oriented as the leaf surface is oriented, to read what the plant sees. A reading taken 15 cm above a dense lettuce canopy in our logs averaged 1,800 lux higher than a reading taken at the canopy surface on the same day.
'I added more nutrients on a cloudy day because EC had dropped, and then the plant showed signs of excess when the sun came back.'
The grower responded to an EC drop during a low-lux period by topping up to target, then the light returned and the plant began consuming at a high rate from a reservoir that was already at target and climbing. The nutrient excess on the sunny day was not from over-dosing at the moment of dosing -- it was from dosing at the wrong point in the lux cycle. The correction needed on a cloudy day is smaller than on a clear day, or deferred until the lux pattern is clearer.
What growers miss when they log EC without logging lux
Below 4,200 lux in our data, the lux-EC correlation breaks. Growers who build a calibration during a high-lux period and then apply it during a low-lux period will get predictions that do not hold. Worse, they may see EC drop erratically and assume a root problem or sensor fault, when the actual cause is the plant switching from photosynthesis-driven to stress-driven ion uptake. The sub-threshold zone needs its own management logic -- it is not a dimmer version of the above-threshold zone.
The sub-threshold zone
Bangkok sits at 13 degrees north latitude. The sun angle changes meaningfully across the year -- the difference in noon solar elevation between December and May is approximately 25 degrees. For a grow room with a south-facing window, this changes the direct sunlight footprint on the canopy by a measurable amount across the crop cycle. A BH1750 calibrated in one season will see different baseline readings in another season from the same grow light setup, because ambient contribution through the window changes. Growers running year-round in Bangkok without accounting for seasonal drift are running on a calibration that becomes less accurate over six months.
Seasonal sun angle drift in Bangkok
A lux spike at midday does not produce an instantaneous EC drop -- the uptake happens over the following hours as the plant processes the photosynthate and the transpiration stream carries nutrients. In our logs, the EC reading taken the following morning reflected the previous day's peak lux more reliably than it reflected the previous day's lux average. This means the lux reading that predicts tomorrow's EC drop is today's peak, not today's average. Growers logging only averages are working with a slightly blurred version of the correlation.
The lag between light event and EC response
A 0.1 mS/cm EC drop in a 20-litre reservoir represents a different absolute nutrient removal than a 0.1 mS/cm drop in a 5-litre reservoir. Comparing lux-EC correlations across systems of different volumes requires normalising the EC drop by reservoir volume. Growers who compare their lux-drop numbers against other growers' reported numbers without knowing the reservoir volume of the other system are comparing incompatible figures. The correlation we report from our data is calibrated to our specific tower reservoir volume -- the ratio holds, but the absolute mS/cm numbers need recalibration for different system sizes.
Reservoir volume and the normalisation problem
Building a lux-adjusted nutrient management protocol that works in Bangkok
Any grower starting a new hydroponic crop cycle
Position the BH1750 at canopy level, oriented as the upper leaf surface is oriented -- not aimed at the light source, not mounted above the canopy. Log the daily average lux alongside daily EC (taken at the same time each morning before any top-up) for the first 10 to 14 days of the cycle. Do not make lux-based nutrient adjustments during this calibration period -- just collect the paired data.
A crop-specific lux-to-EC-drop coefficient that reflects your actual system, your reservoir volume, your ambient light conditions, and your specific crop variety. This is the number that makes the rest of the cycle manageable.
Growers who have completed the initial calibration period
Take a morning BH1750 reading at canopy level and compare it to your calibrated lux-drop coefficient. If the current lux reading predicts a drop of more than 0.15 mS/cm for the day, consider a pre-emptive partial top-up to the upper end of your target EC range before the drawdown occurs. This is the difference between reactive and anticipatory nutrient management.
The reservoir stays within 0.1 to 0.15 mS/cm of target EC across the crop cycle rather than oscillating. High-light days -- when the crop most needs nutrients -- are the days the reservoir is best supplied.
Growers entering Bangkok monsoon season (May through October)
Flag the first clear day after any sustained overcast period (2 or more consecutive days below 4,000 lux at canopy) as a high-risk day for EC drawdown. Check EC at midday on that day, not just in the morning. The crop will be catching up on uptake from the low-light period and the drawdown can be faster than the calibrated coefficient predicts for a single day.
The monsoon-season EC crash pattern -- accumulation during overcast, sharp drop on the first clear day -- gets caught before it drives EC to a level the crop cannot recover from in the remaining cycle time.
Growers seeing erratic EC drop with no clear lux correlation
Check whether you are operating in the sub-threshold lux zone. If your daily BH1750 averages are running below 4,200 lux at canopy level, the lux-EC correlation is not reliable. Options are to increase light intensity above the threshold (the relationship then becomes predictable again) or to manage the low-light period with more frequent EC checks and smaller top-ups rather than trying to apply a coefficient that does not hold below threshold.
A clear diagnosis of whether erratic EC is a low-light problem or something else. If lux is above threshold and the correlation is still not holding, look at root zone health, reservoir temperature, and probe calibration in that order.
Logging both variables in the same place at the same time. Growers who log EC in one notebook and check lux occasionally on a separate device never build the correlation because the data never gets compared. The pairing has to be systematic -- same time of day, same log, same cycle reference. Without that, the lux data is interesting but not actionable.
FAQ
Does light intensity affect how fast EC drops in a hydroponic reservoir?
Yes, and the relationship is measurable with a BH1750 sensor at canopy level. Above 4,200 lux, every 1,000 lux increase correlated with an additional 0.06 to 0.09 mS/cm of EC drop per 24-hour period across 22 grow cycles logged in Bangkok. Below 4,200 lux, the correlation broke down and EC drop became unpredictable. Plant Mood grow log data, 2024.
Where should I mount a BH1750 sensor to measure light for hydroponic nutrient management?
At canopy level, oriented as the upper leaf surface is oriented. A sensor mounted 15 cm above the canopy reads incident light, not what the plant receives -- in our logs this divergence ranged from 800 to 2,400 lux depending on canopy density. A reading that does not reflect what the leaf surface sees cannot predict nutrient uptake accurately.
Why does my hydroponic EC drop unevenly across different weeks?
Almost certainly light variability. In Bangkok, cloud cover and seasonal sun angle produce week-to-week lux variation large enough to shift daily EC drop by 0.1 to 0.2 mS/cm on the same nutrient concentration. If you are not logging BH1750 lux alongside EC, the EC pattern looks random. Log both variables at the same time each morning for 10 to 14 days and the correlation becomes visible in your own data.
What is the lux threshold below which EC drop becomes unpredictable in hydroponics?
In our grow log data, 4,200 lux at canopy level was the threshold below which the linear lux-to-EC-drop correlation broke down. Below this point, EC drop ranged from 0.04 to 0.19 mS/cm with no consistent relationship to lux. The likely cause is a shift from photosynthesis-driven to stress-driven ion uptake at low light. Plant Mood grow log data, 2024.
How does Bangkok monsoon season affect hydroponic nutrient consumption?
The monsoon pattern of two to three overcast days followed by one to two clear days creates a predictable EC accumulation and crash cycle. EC climbs slightly above target during overcast periods (lower uptake, same feeding schedule) then drops sharply on the first clear day as the crop catches up on uptake. In 7 of 12 monsoon-season cycles logged, the daily EC low for the entire cycle occurred on the first clear day after a sustained overcast period. Plant Mood grow log data, 2023 to 2024.
Can I predict EC drop in advance using lux readings?
Yes, once you have 10 to 14 days of paired BH1750 and EC data from your own system. Morning lux readings provided 12 to 18 hours of lead time for pre-emptive nutrient top-up in our grow cycles. The key is that peak daily lux predicts next-morning EC drop more reliably than daily average lux, because plant uptake lags the light event by several hours.
Does humidity in Bangkok affect the lux-to-EC-drop relationship?
Yes. High relative humidity (75 to 85 percent, typical for Bangkok indoors without dehumidification) reduces vapour pressure deficit, which partially suppresses transpiration even at high lux. This compresses the lux-to-EC-drop ratio compared to temperate climates. In our data, the actual EC drop on high-humidity, high-lux days ran approximately 15 percent below what the lux reading alone would predict using a temperate-climate coefficient. Calibrate against your own system data rather than imported coefficients.