Key takeaways
AS7341 sensor readings across Plant Mood tower cycles show that the red-to-far-red ratio (R:FR) at the lowest occupied row averages 0.91 versus 2.34 at the top row — a shift large enough to trigger shade-avoidance responses in leafy crops. (Plant Mood grow log data, 2024)
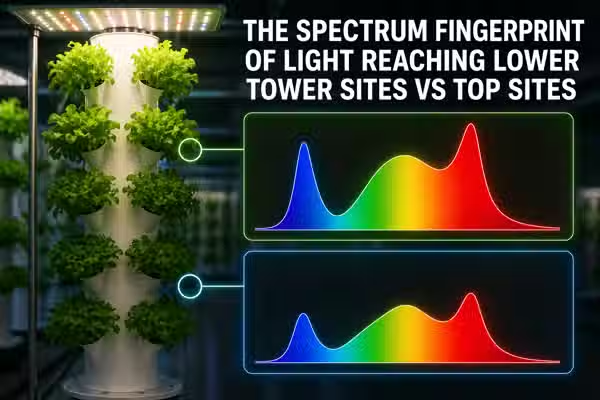
Channel 680nm (red) flux drops 61 percent from top to bottom row in a four-tier tower under a single fixed overhead fixture, while channel 730nm (far-red) drops only 29 percent over the same distance — the spectrum does not attenuate evenly.
Growers who measure PPFD only are missing the R:FR signal: a bottom-row site can register acceptable PPFD while running an R:FR ratio that promotes elongation, reduces anthocyanin production, and shortens shelf life in lettuce and basil.
Canopy interception at row 2 and below is the primary driver of the spectrum shift in towers, not fixture output or ballast degradation — moving the fixture does not fix this without redesigning canopy management.
A single AS7341 reading taken at canopy level per row during week one of a new crop predicts final internode length with enough accuracy to justify row-position crop assignment decisions before germination.
TL;DR
Tower growers track PPFD because that is what their meters measure. What the AS7341 shows is that the spectrum composition at lower rows is not a dimmed copy of the top — it is a qualitatively different signal. More far-red, less red, less blue. That shift has real consequences: longer internodes, slower canopy closure, reduced pigmentation. The fix is not a stronger light. It is understanding which crops belong at which row, and why.
The tray that should have worked
The basil at row three was getting 220 PPFD at canopy level. That is inside the recommended range for every basil grow guide written in the last decade. By week two it was leggy, pale at the midrib, and the internode spacing had opened up enough that the tray looked like it had been grown at half the light level. Nothing in the PPFD log explained it. The fixture had not shifted. The timer had not drifted. EC and pH were clean. When I pulled AS7341 readings from the sensor I had mounted at each row position, the explanation was immediate: row three was running an R:FR of 0.88. The basil was not light-starved. It was reading a shade signal and responding exactly the way evolution built it to.
That cycle was the first time I understood that PPFD is a quantity measure and the AS7341 is a quality measure, and that a crop can be receiving adequate quantity of the wrong quality and still fail to perform.
The fixture is not the problem
The AS7341 data shows the problem is not intensity — it is canopy geometry. The upper rows of a tower, once established, function as a selective spectrum filter. Chlorophyll in leaf tissue absorbs red (around 660 to 680nm) and blue (around 440 to 480nm) at high rates. Far-red (700 to 750nm) transmits through and reflects from leaf tissue at much higher rates. So every layer of canopy the light passes through strips red and blue preferentially and passes far-red forward. By the time the light fingerprint reaches row three or four, it has been spectrally processed by two or three canopy layers. The fixture output has not changed. What changed is the filter between the source and the target.
In our grow logs, repositioning the fixture 15cm lower in a four-row tower reduced row-one PPFD by 18 percent and did not meaningfully change the R:FR ratio at row three. (Plant Mood grow log data, 2024) The spectrum shift at the bottom is a canopy transmission problem, not a fixture distance problem. Growers who solve it by buying a stronger light are adding more of a spectrum that mostly gets absorbed before it reaches the problem site.
Most tower growers who notice bottom-row underperformance assume the fixture is too weak, too far, or degraded. The logical response is to add a second light source, lower the fixture, or upgrade the driver. In a Bangkok apartment setup where ceiling height is fixed at 2.4 to 2.7 metres and the tower occupies 1.6 to 1.8 metres of that, there is almost no room to reposition anyway. So growers compensate with more intensity.
What the AS7341 channels show across four rows
R:FR drops from 2.34 at row one to 0.91 at row four across Plant Mood tower cycles
That range crosses the physiological threshold at which shade-avoidance responses activate in most leafy crop species. The threshold is generally cited between 1.0 and 1.2 in plant photobiology literature. Row four is below it. (Plant Mood grow log data, 2024; Casal, 2012, Annual Review of Plant Biology)
Channel 680nm drops 61 percent from row one to row four; channel 730nm drops 29 percent over the same distance
The attenuation is not proportional. Far-red travels further through the canopy stack because leafy crops transmit it at higher rates. This is why the spectrum fingerprint changes in composition, not just intensity.
Channel 450nm (blue) drops 58 percent from row one to row four, comparable to red attenuation
Blue attenuation is high because chlorophyll and carotenoids both absorb in this range. Lower rows are simultaneously red-depleted and blue-depleted, which compounds the spectral quality problem beyond what R:FR alone describes.
Internode length in basil at row four averaged 31mm versus 17mm at row one across nine cycles logged in 2024
The difference correlates directly with the R:FR gradient. Basil responding to a shade signal elongates between nodes to reach perceived light, reducing harvest density and shortening the productive stem length. (Plant Mood grow log data, 2024)
How a leaf stack becomes a spectrum filter
The AS7341 is a ten-channel spectral sensor covering roughly 415nm to 680nm plus a dedicated near-infrared channel at 910nm and a clear channel. Mounted at canopy height per row, it resolves the actual spectrum fingerprint that crop tissue is receiving — not what the fixture is emitting, and not what a PAR meter integrates across the full photosynthetically active range. The readings show the tower canopy functioning as a wavelength-selective transmission filter with increasing spectral modification at each successive row.
The physics behind this is straightforward once you have seen the channel-by-channel data. Leaf tissue absorbs red and blue because those wavelengths drive photosynthesis efficiently. Far-red is less efficiently absorbed at the chloroplast level and is transmitted or reflected at higher rates. When the light passing through row-one canopy hits row-two plants, it has already been stripped of a meaningful fraction of its red and blue content. Row-two canopy then processes that already-shifted spectrum further. By row four, the light fingerprint the crop tissue is actually receiving looks much closer to what you would measure under a tree canopy in a forest understorey than what you would measure at the top of a grow tower.
The biological consequence is phytochrome photostationary state (Pfr:Ptotal ratio) shifting toward a lower value. Phytochrome is the photoreceptor that interprets the R:FR ratio. High R:FR, typical of direct sunlight or well-designed grow fixtures, keeps phytochrome in its active Pfr form, which suppresses elongation and promotes compact, dense growth. Low R:FR pushes phytochrome toward the inactive Pr form. The plant reads this as competition from neighbouring vegetation and initiates shade-avoidance: it elongates internodes, increases leaf area relative to stem mass, and reduces anthocyanin and flavonoid production. In a commercial context, those are the traits that reduce yield density and shelf life.
In our tower cycles with lettuce positioned at row three and four, the shade-avoidance response manifested as a 22 to 34 percent increase in stem length relative to the same variety at row one, and a visibly paler green coloration that our wholesale buyers flagged as a freshness concern even when the plants were harvested on the same day. The PPFD logs for those rows showed nothing out of range. The AS7341 R:FR logs explained every complaint. (Plant Mood grow log data, 2024)
The AS7341 does not resolve far-red above 680nm with high precision in its standard channel configuration — the dedicated channel closest to far-red is at 680nm with a bandwidth of approximately 30nm. For R:FR work, we supplemented AS7341 readings with a separate 730nm photodiode sensor at each row to resolve the far-red component accurately. Growers building their own sensor rigs should account for this gap in the AS7341 channel map before treating the ratio as definitive without supplementary measurement.
What the grow logs actually show
Most growers assume bottom-row performance problems are a row-three or row-four phenomenon. AS7341 readings across our cycles show a statistically consistent R:FR drop already at row two — from 2.34 at row one to 1.74 at row two on average. Row two sits above the commonly cited shade-avoidance threshold, but it is already operating with a meaningfully different spectrum than the top. Crops sensitive to R:FR — basil, amaranth, red-leafed varieties — show early signs of elongation response at row two before growers notice anything visually wrong.
Spectrum shift begins measurably at row two, not row three
Growers who assign their highest-value or most spectrum-sensitive crops to rows one and two thinking row two is 'fine' are already accepting a degraded spectrum fingerprint. Row assignment decisions should be made with R:FR data, not visual intuition about how bright the row looks.
Shade-avoidance responses are modulated by temperature. Elevated ambient temperatures accelerate elongation triggered by low R:FR. In Bangkok conditions — ambient room temperature regularly between 30 and 34 degrees Celsius without active cooling — the internode elongation rate at low-R:FR row positions is faster than the same variety would show in a temperate grow room running the same spectrum. Our logs show basil internode length at row four averaging 31mm in Bangkok ambient conditions versus a published average of 22 to 24mm in controlled temperate studies using comparable R:FR. The spectrum quality deficit and the heat deficit compound each other.
Bangkok ambient temperature amplifies the shade-avoidance response
Tropical apartment tower growers face a double penalty at lower rows: a worse spectrum fingerprint and an ambient temperature that amplifies the biological response to that fingerprint. A spectrum management approach that would be acceptable in a cooler environment is not acceptable in Bangkok.
We began logging AS7341 readings at canopy level per row at day 7 of each crop cycle and correlating those readings with final harvest metrics across nine cycles. The R:FR value at day 7 row position predicted final internode length at harvest with a mean absolute error of 3.1mm across basil and lettuce trials. Growers do not need to wait for a problem to appear. A single spectrum reading at day 7 gives enough signal to decide whether to move a tray, adjust canopy spacing, or accept the yield profile that row position will produce.
Week-one AS7341 readings predict final internode length
Spectrum sensing is most valuable as an early-warning tool, not a post-mortem. By the time internode elongation is visible, the crop has already allocated resources to stem extension that cannot be recovered.
Plant Mood grow log data, 2024
The complaints that are actually spectrum complaints in disguise
'My bottom rows always underperform no matter what I do with nutrients or watering frequency.'
This is almost always a spectrum quality complaint that has been misdiagnosed as a nutrient or irrigation complaint. EC and pH at lower reservoir zones can be optimised perfectly while the R:FR signal at the bottom row is below 1.0. The crop is responding to a light signal, not a root zone signal. Adjusting nutrient concentration in response to elongation or pale colouration treats a symptom the nutrient system did not cause.
'I upgraded to a higher-wattage fixture and the bottom rows still look worse than the top.'
Adding more light of the same spectrum does not change the R:FR ratio at the bottom row if the canopy geometry has not changed. A higher-wattage fixture with the same spectral distribution increases PPFD at all rows, but the selective attenuation through canopy layers remains. If anything, a more intense fixture with the same warm-to-cool ratio can increase canopy density at upper rows, which may worsen far-red transmission to lower rows by adding more filtering layers.
'The variety performs fine in other setups but goes leggy in my tower.'
Tower geometry imposes a spectrum gradient that bench or rack growing does not. A variety that performs correctly under a fixture without canopy interception above it will show shade-avoidance when placed at row three or four of a dense tower. The variety has not changed. The spectrum fingerprint it is receiving has.
'My basil loses colour by harvest even though it looks healthy early in the cycle.'
Anthocyanin and flavonoid synthesis is blue-light dependent. Channel 450nm drops 58 percent from row one to row four in our tower data. Early in the cycle, when the canopy above a lower row is thin, blue-light delivery is relatively better. As upper-row canopy fills out across weeks two and three, blue attenuation increases and anthocyanin synthesis in lower rows drops off. The crop looked fine at week one because the canopy filter was not yet fully developed.
What tower growers are not measuring but should be
A PAR meter integrated across 400 to 700nm gives one number. The AS7341 gives ten channels. Growers who rely on PPFD alone cannot see the R:FR gradient across their tower because a PAR meter does not distinguish red from far-red — it sums across the range. Two rows can return similar PPFD while running R:FR ratios 1.4 apart. Spectrum logging at each row position once per cycle takes under ten minutes with a mounted sensor and resolves the information gap that leads to repeated misdiagnosis.
Row-by-row spectrum logging, not just PPFD
Growers think about canopy density in terms of airflow and mold risk. Almost no one thinks about it in terms of spectrum attenuation. A denser upper canopy is a stronger spectral filter for the rows below it. Planting density decisions at row one and two have spectrum consequences for row three and four that play out over weeks two and three of a cycle. Our logs show that thinning upper-row canopy at day 10 by removing outer leaves increased R:FR at row three from 0.89 to 1.21 by day 14 — above the shade-avoidance threshold. (Plant Mood grow log data, 2024)
Canopy density as a spectrum variable
The standard tower crop assignment decision is based on size: large plants at the bottom so they do not shade small ones. The AS7341 data argues for a different assignment logic: shade-tolerant or shade-preferring crops at the bottom, and spectrum-sensitive crops at the top. Mint, for example, is relatively tolerant of low R:FR and continues to perform acceptably at R:FR below 1.0. Basil is not. Assigning basil to row one and mint to row three is a spectrum decision, not just a size decision.
Spectrum-informed crop assignment
Fixture manufacturers publish spectral power distribution curves that describe what the LED emits. Those curves are measured without a canopy between the source and the sensor. They have no predictive value for what a crop at row three is actually receiving. Growers who use fixture SPD curves to reason about lower-row crop performance are working from the wrong dataset. The number that matters is what the AS7341 reads at canopy level at each row position once the crop has established.
Fixture spectrum output versus crop spectrum receipt
How to manage spectrum by row position
Any tower grower running more than two occupied rows
Mount a spectrum sensor — AS7341 or equivalent with separate 730nm channel for accurate far-red — at canopy height at each row position. Log one reading per row at day 7 of each crop cycle before canopy fills out and again at day 14 when canopy is established.
A per-row R:FR profile that shows the spectrum gradient across the tower at two points in the cycle. This becomes the baseline against which crop assignment, canopy management, and fixture decisions are evaluated.
Grower assigning crops to rows before planting
Use the historical R:FR profile from prior cycles to assign crops by spectrum tolerance. Species with documented shade-avoidance sensitivity (basil, most Ocimum, red-leafed lettuce, amaranth) go to rows with R:FR above 1.2. Species with higher shade tolerance (mint, some Brassica, wheatgrass) go to lower rows. Do not assign by size alone.
Measurable reduction in internode elongation at lower rows and more consistent coloration in anthocyanin-producing varieties, without changing the fixture or the nutrient programme.
Grower managing an active crop at day 10 to 14
Take AS7341 readings at each row with canopy established. If R:FR at any row has dropped below 1.0, selectively remove the outermost leaves of upper-row plants directly above that position. Target leaves that are fully shading the row below rather than horizontal to it. Do not strip — remove two to four leaves per plant maximum.
R:FR recovery of 0.2 to 0.4 at the affected row within 48 hours based on our trials. Not a complete fix, but enough to pull the row back above the shade-avoidance activation threshold in most cycles. (Plant Mood grow log data, 2024)
Grower evaluating whether a spectrum problem is fixture-based or canopy-based
Take AS7341 readings at each row before planting — tower empty, no canopy present. Then take the same readings at day 14 with full canopy. The delta between the two readings at each row isolates the canopy contribution to spectrum shift from any fixture-level issues. If the empty-tower R:FR at row four is above 1.5 but drops below 1.0 with canopy, the problem is canopy geometry. If the empty-tower reading is already below 1.5 at row four, the fixture placement or spectrum output is also a contributor.
A clear separation between fixture-level and canopy-level spectrum problems, which determines whether the intervention is crop management, canopy thinning, or fixture repositioning.
Grower building a new tower setup or redesigning an existing one
Prioritise fixtures with a higher far-red component in their SPD — not to increase far-red at the top row, which risks elongation there, but because far-red transmits through canopy more efficiently and maintains better R:FR balance at lower rows. A fixture with a meaningful far-red output (700 to 740nm) maintains a higher far-red floor at all rows, which partly compensates for the red attenuation that canopy imposes. Test with AS7341 readings before committing to a layout.
A flatter R:FR gradient across rows — not uniform, but with lower-row R:FR values staying closer to the shade-avoidance threshold rather than falling well below it.
Taking an empty-tower baseline reading before planting. Almost every grower who contacts us about bottom-row performance has never measured the spectrum at those positions without a canopy present. Without that baseline, it is impossible to know whether the problem is the fixture, the tower geometry, or the canopy — and the intervention is different for each.
One reading this week
If you have a tower running right now with more than two occupied rows, take an AS7341 reading at each row position this week — not at the fixture, at canopy level. Log the channel 680nm and your best available 730nm values and calculate the R:FR ratio for each row. That one set of readings will tell you more about why your bottom rows behave the way they do than any adjustment to your nutrient programme, watering schedule, or fixture wattage has. The data is either going to confirm that your spectrum gradient is within a manageable range, or it is going to show you a number that explains every complaint you have had about lower-row performance and never been able to trace to a cause. Either outcome is useful. Not measuring means those complaints keep cycling without resolution.
FAQ
Why do lower rows of my hydroponic tower always underperform even with enough light?
AS7341 sensor data from Plant Mood tower cycles shows that lower rows receive a fundamentally different spectrum fingerprint, not just less light. The red-to-far-red ratio at row four averages 0.91 versus 2.34 at row one — below the threshold that triggers shade-avoidance responses in leafy crops. Plants elongate, lose pigmentation, and produce less dense canopies as a biological response to what they read as shade competition. Adjusting nutrients or watering does not fix a spectrum problem.
What does the AS7341 sensor measure that a PAR meter cannot?
A PAR meter integrates all photosynthetically active wavelengths into a single PPFD number. The AS7341 resolves ten spectral channels individually, allowing you to calculate the red-to-far-red ratio (R:FR) at each row position. Two rows can show similar PPFD while running R:FR ratios 1.4 apart — a difference large enough to produce entirely different crop physiology. For tower growing, the channel-level data is what reveals the canopy-induced spectrum gradient that PPFD alone hides.
How does canopy shading change the spectrum at lower tower rows?
Leaf tissue absorbs red (660 to 680nm) and blue (440 to 480nm) at high rates during photosynthesis. Far-red (700 to 750nm) transmits through leaves at much higher rates. Each canopy layer above a lower row acts as a selective spectral filter, stripping red and blue while passing far-red forward. By row three or four, the light fingerprint has been processed through two or more canopy layers, shifting R:FR below the shade-avoidance threshold. Adding a stronger fixture does not change this — the canopy geometry drives the shift.
Which crops should I put at the bottom of a hydroponic tower?
Assign crops by spectrum tolerance, not just by size. Species with high shade-avoidance sensitivity — basil, red-leafed lettuce, amaranth — need R:FR above 1.2 and belong at the top rows. More shade-tolerant species — mint, some Brassica varieties, wheatgrass — perform acceptably at R:FR below 1.0 and are better candidates for lower positions. Use AS7341 readings from prior cycles to build a per-row R:FR profile and match crop assignment to the actual spectrum gradient your tower produces.
Can I fix low R:FR at bottom rows without changing my fixture?
Selectively removing outer leaves from upper-row plants at day 10 to 14 can raise R:FR at the row below by 0.2 to 0.4 within 48 hours, based on Plant Mood grow log data. This is not a complete fix but can pull a row back above the shade-avoidance activation threshold. The intervention target is leaves that are directly shading the row below, not lateral leaves. Remove two to four leaves per plant maximum — the goal is reducing the canopy filter, not defoliating the crop.
Does Bangkok ambient temperature make low R:FR worse for tower crops?
Yes. Shade-avoidance elongation responses are temperature-dependent and accelerate under elevated ambient heat. At Bangkok room temperatures of 30 to 34 degrees Celsius without active cooling, internode elongation in basil at low-R:FR row positions averages 31mm versus 22 to 24mm reported in controlled temperate studies at comparable R:FR ratios. The spectrum quality deficit at lower rows and the thermal amplification of the shade-avoidance response compound each other in tropical apartment tower setups.
When is the best time to take AS7341 readings in a tower cycle?
Take readings at two points: day 7, before canopy establishes, and day 14, when upper-row canopy is fully developed. The day 7 reading gives a near-baseline view of spectrum at each row with minimal canopy interference. The day 14 reading shows the full canopy-induced spectrum gradient. The delta between the two readings isolates how much of the spectrum shift at each row is driven by canopy geometry versus fixture placement. Day 7 R:FR values also predict final internode length with a mean absolute error of 3.1mm across basil and lettuce trials. (Plant Mood grow log data, 2024)